† indicates equal contribution.
Recent Publications (Complete List...)
2025
[J41]

Reuben Luera, Ryan Rossi, Alexa Siu, Franck Dernoncourt, Tong Yu, Sungchul Kim, Ruiyi Zhang, Xiang Chen, Hanieh Salehy, Nedim Lipka, Samyadeep Basu, Puneet Mathur, Jian Zhao.
Survey on User Interface Design and Interactions for Generative AI Applications. Foundations and Trends in Human-Computer Interaction, 19(3), pp. 213-289, 2025.
[J40]
Grace Guo, Subhajit Das, Jian Zhao, Alex Endert.
More Like Vis, Less Like Vis: Comparing Interactions for Integrating User Preferences into Partial Specification Recommenders. IEEE Transactions on Visualization and Computer Graphics, 2025 (In Press).
[J39]
Di Liu†, Jingwen Bai†, Zhuoyi Zhang, Yilin Zhang, Zhenhao Zhang, Jian Zhao, Pengcheng An.
TherAIssist: Assisting Art Therapy Homework and Client-Practitioner Collaboration through Human-AI Interaction. Proceedings of the ACM on Interactive, Mobile, Wearable and Ubiquitous Technologies, 9(3), pp. 113:1-113:38, 2025.
[J38]
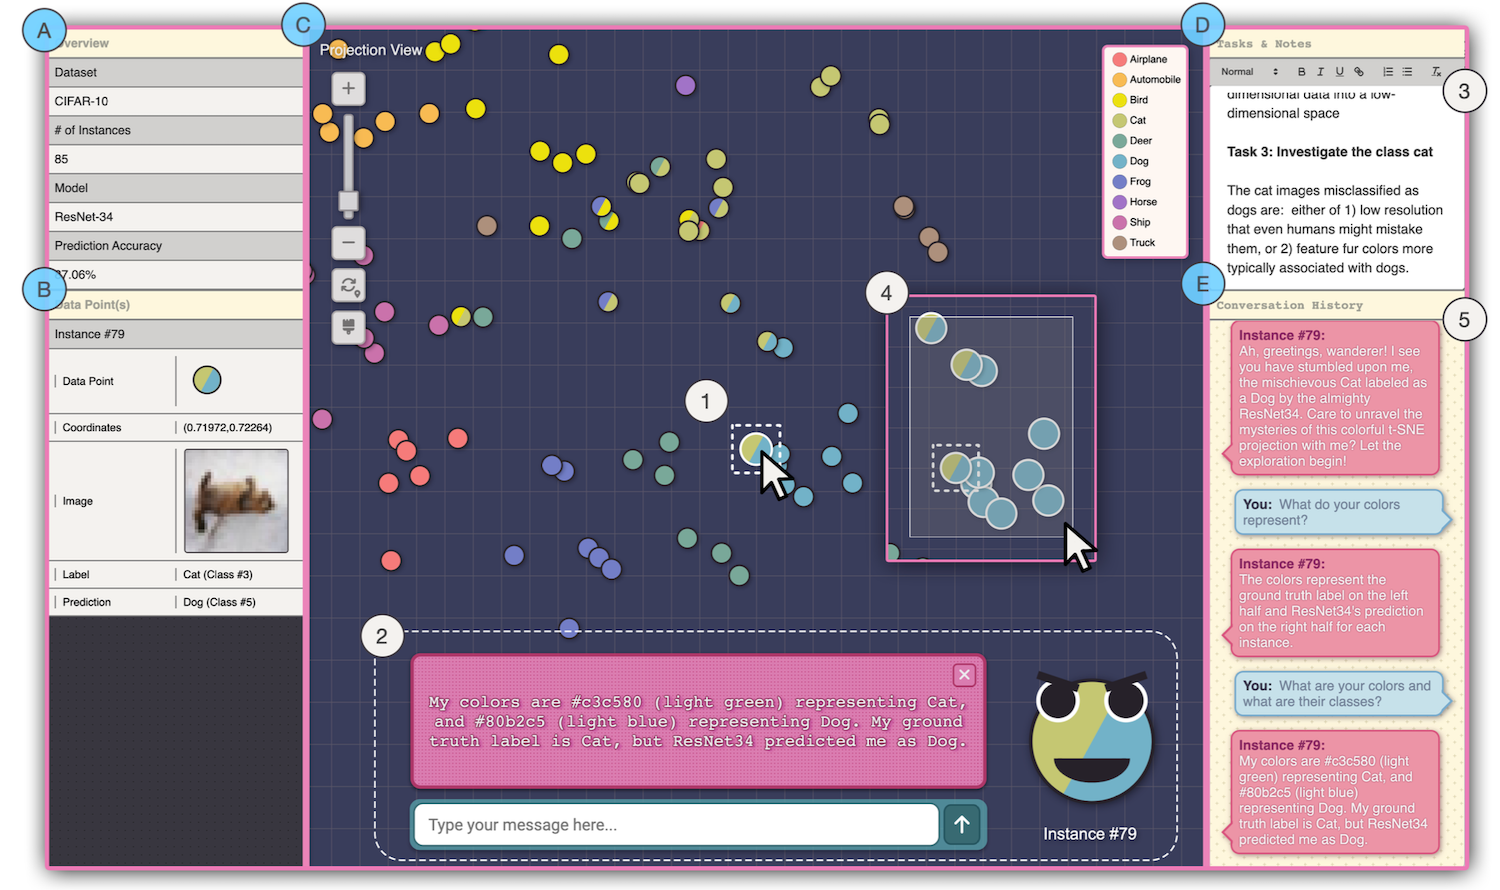
Yuzhe You, Jarvis Tse, Jian Zhao.
Panda or not Panda? Understanding Adversarial Attacks with Interactive Visualization. ACM Transactions on Interactive Intelligent Systems, 15(2), pp. 11:1-11:31, 2025.
[J37]
Jiaqi Jiang, Shanghao Li, Xian Li, Yingxin Xu, Jian Zhao, Pengcheng An.
Playful Antisedentary Interactions for Online Meeting Scenarios: A Research Through Design Approach. JMIR Serious Games, 13(e62778), pp. 1-20, 2025.
[C57]
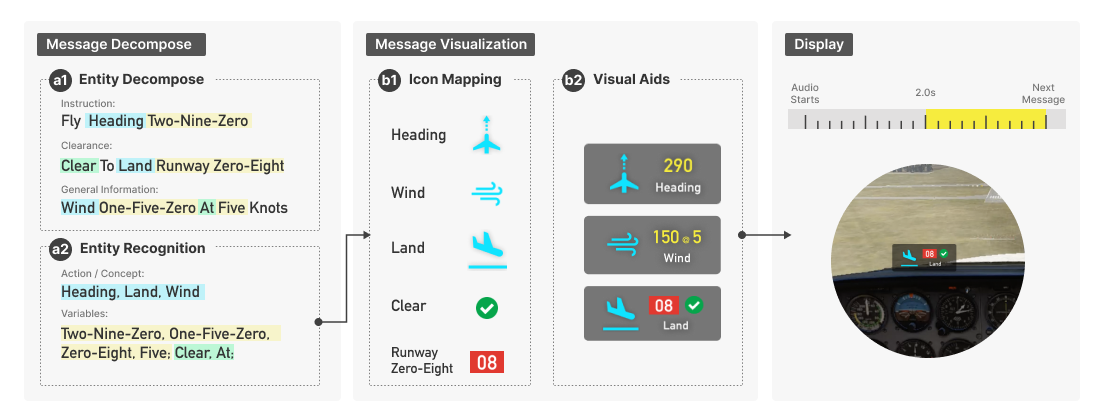
Yue Lyu, Xizi Wang, Hanlu Ma, Yalong Yang, Jian Zhao.
ATCion: Exploring the Design of Icon-based Visual Aids for Enhancing In-cockpit Air Traffic Control Communication. Proceedings of ACM Symposium on User Interface Software and Technology, pp. 73:1-73:21, 2025.
[C56]
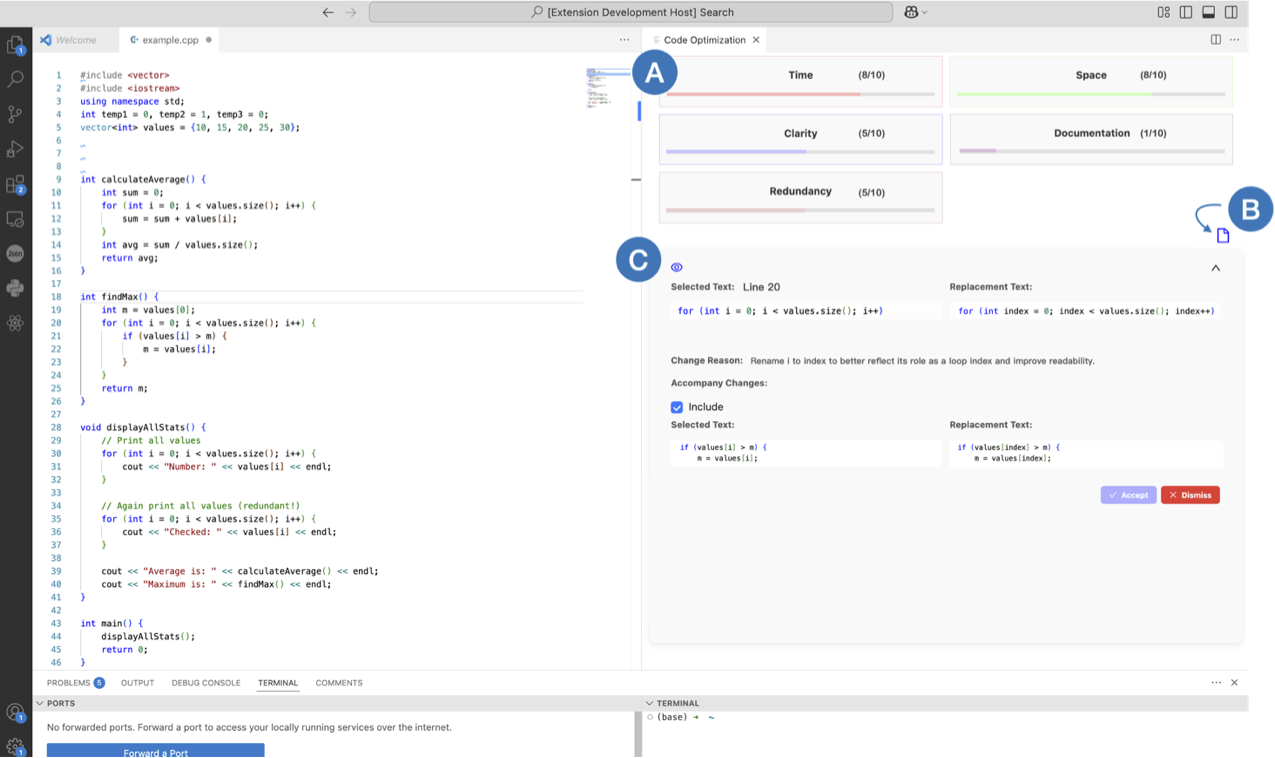
Xuye Liu, Yuzhe You, Tengfei Ma, Jian Zhao.
MACEDON : Supporting Programmers with Real-Time Multi-Dimensional Code Evaluation and Optimization. Proceedings of ACM Symposium on User Interface Software and Technology, pp. 31:1-31:17, 2025.
[C55]
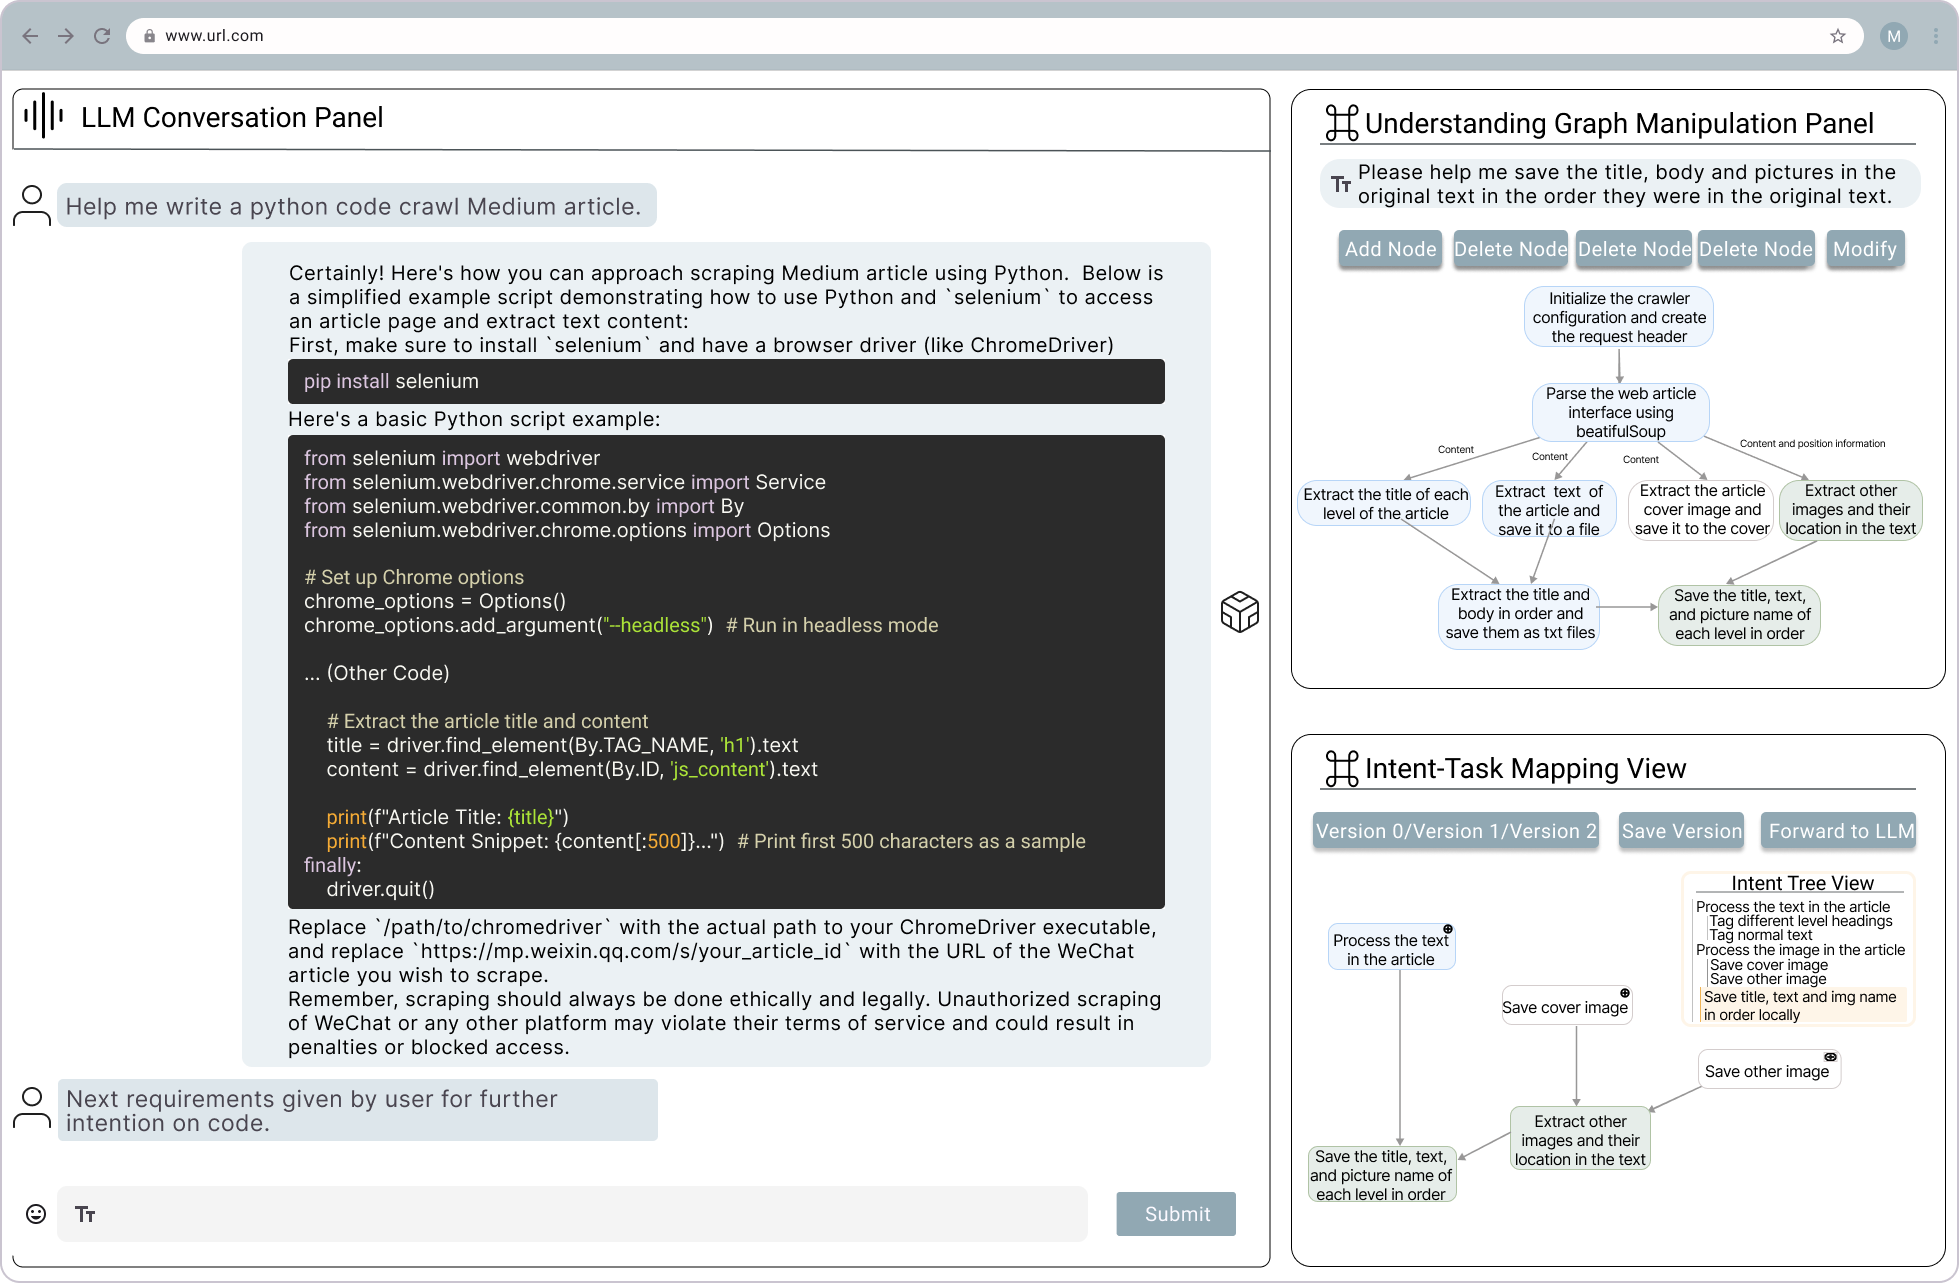
Wenshuo Zhang, Leixian Shen, Shuchang Xu, Jindu Wang, Jian Zhao, Huamin Qu, Linping Yuan.
NeuroSync: Intent-Aware Code-Based Problem Solving via Direct LLM Understanding Modification. Proceedings of ACM Symposium on User Interface Software and Technology, pp. 30:1-30:19, 2025.
[C54]
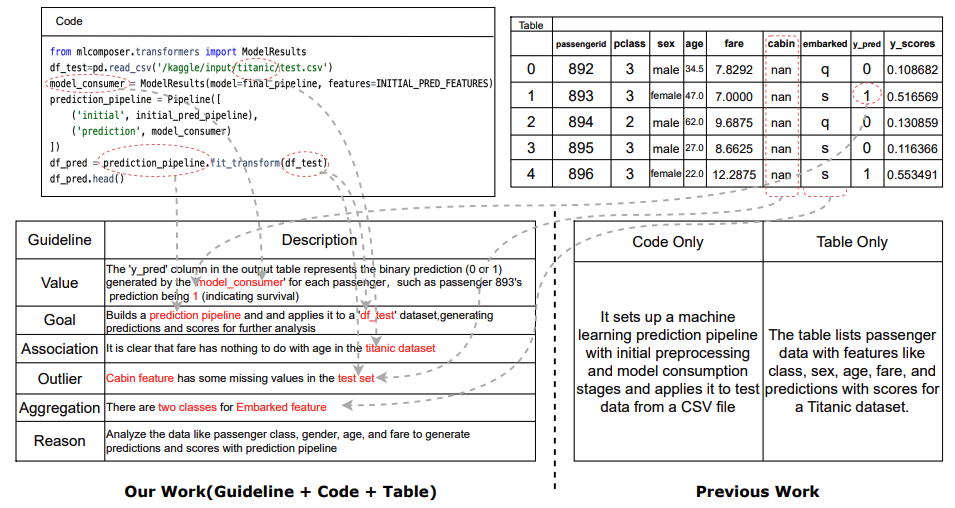
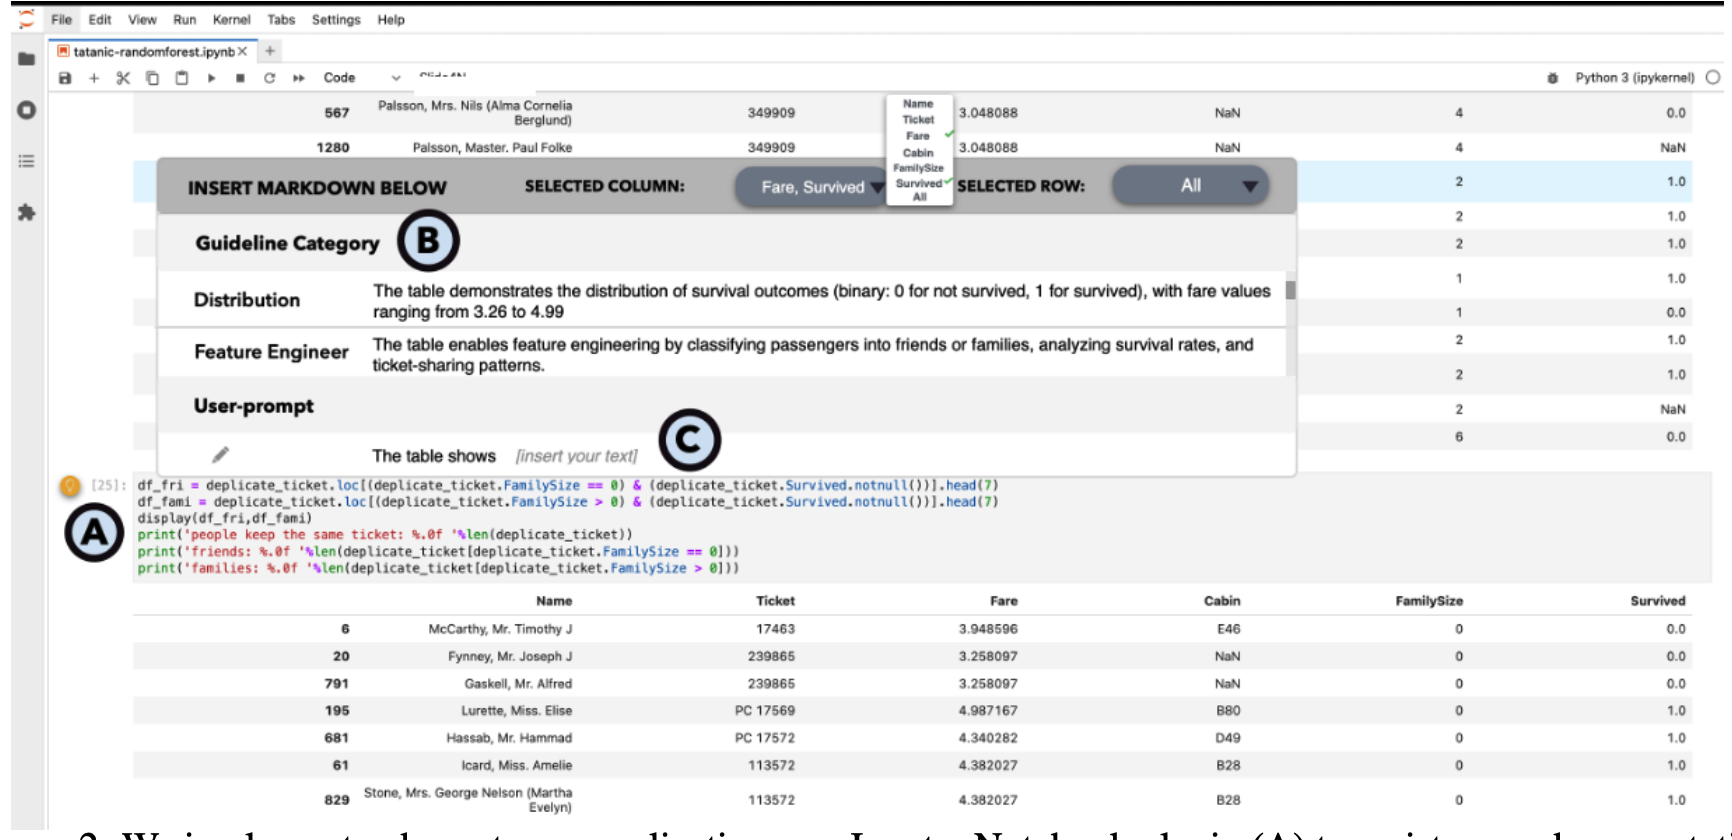
Xuye Liu, Tengfei Ma, Yimu Wang, Fengjie Wang, Jian Zhao.
NBDESCRIB: A Dataset for Text Description Generation from Tables and Code in Jupyter Notebooks with Guidelines. Findings of the Association for Computational Linguistics, pp. 26584–26606, 2025.
[C53]
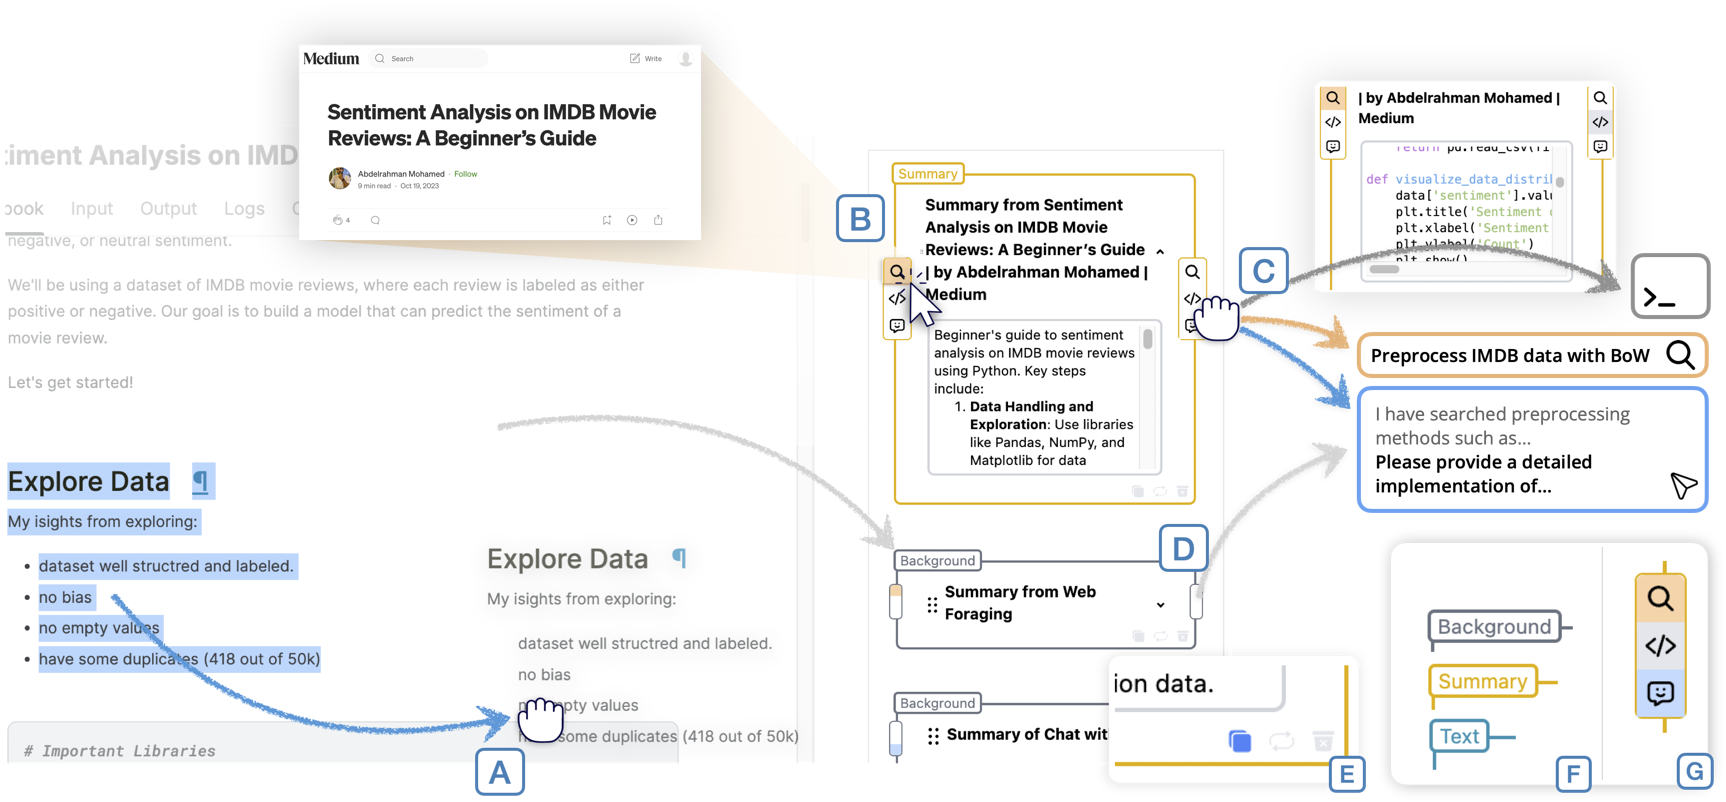
Ryan Yen, Yimeng Xie, Nicole Sultanum, Jian Zhao.
To Search or To Gen? Design Dimensions Integrating Web Search and Generative AI in Programmers' Information-Seeking Process. Proceedings of the ACM Designing Interactive Systems Conference, pp. 1084-1106, 2025.
[C52]
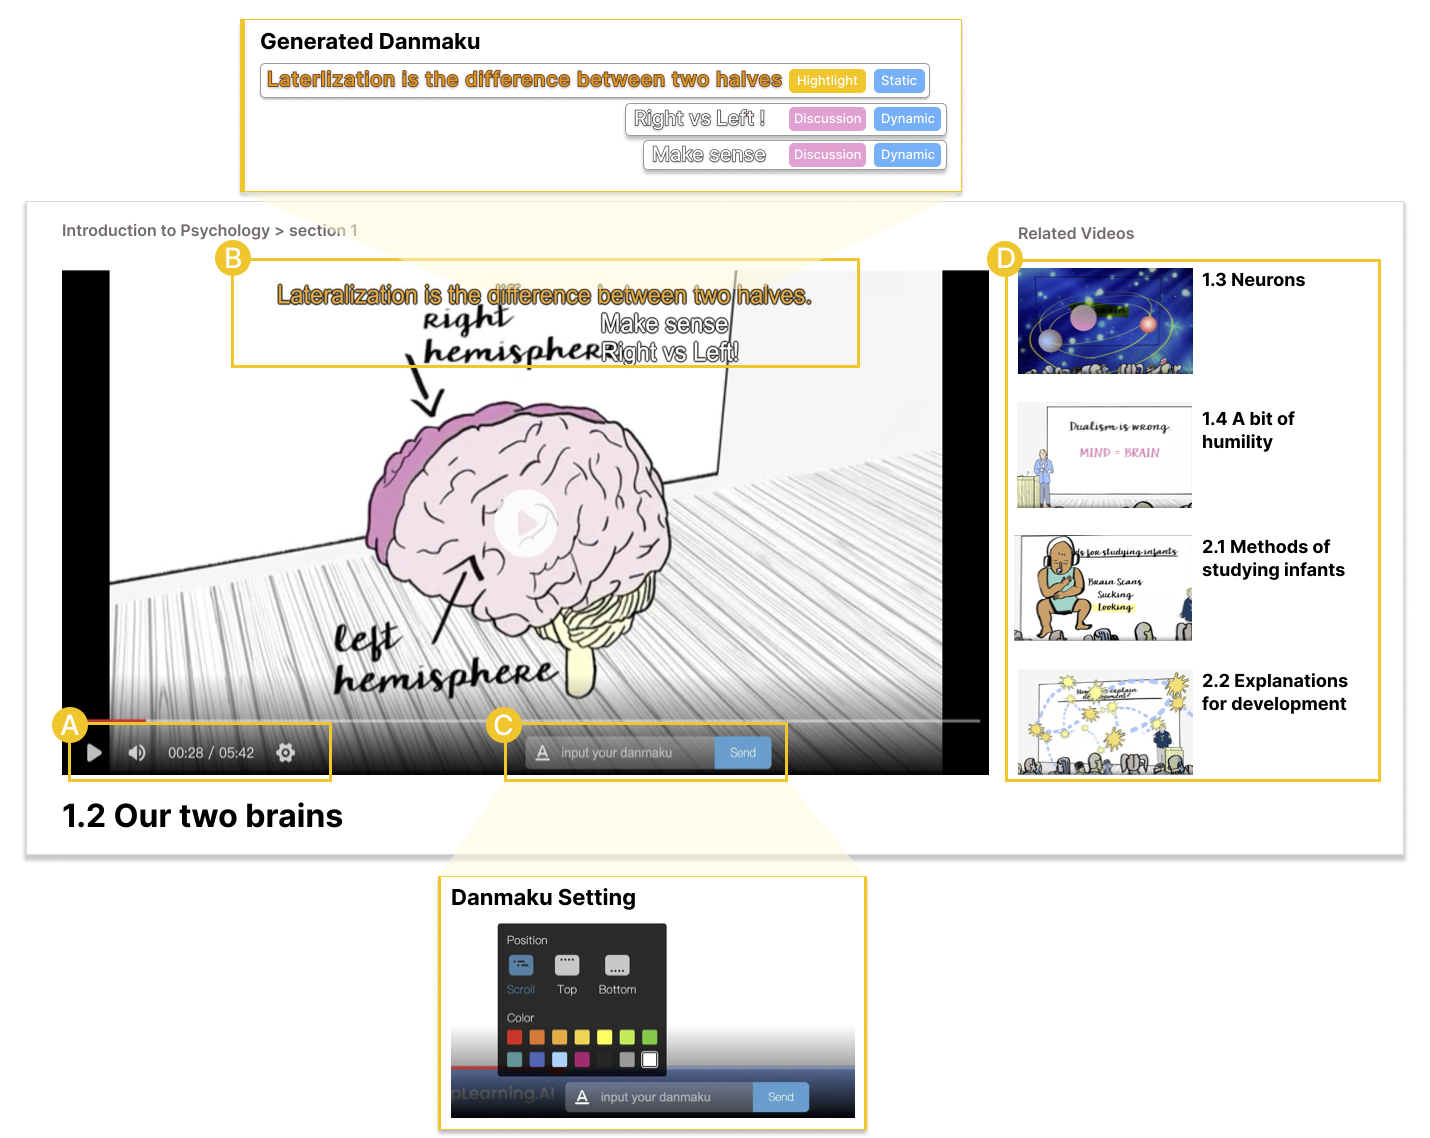
Zipeng Ji, Pengcheng An, Jian Zhao.
ClassComet: Exploring and Designing AI-generated Danmaku in Educational Videos to Enhance Online Learning. Proceedings of the ACM Designing Interactive Systems Conference, pp. 552-575, 2025.
[C51]
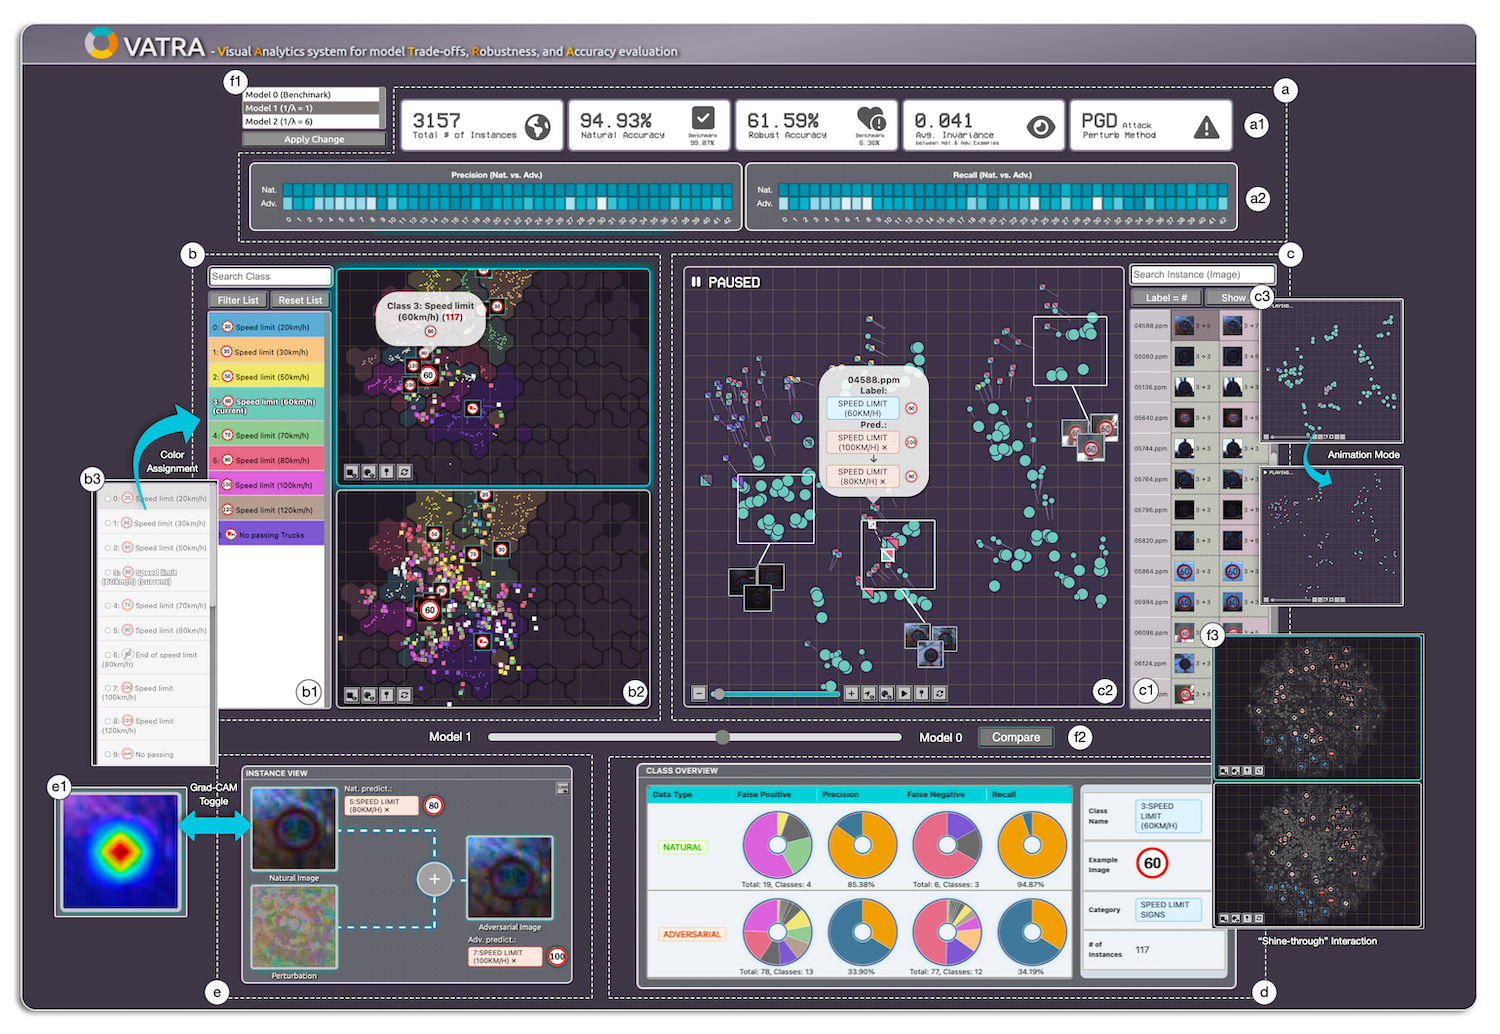
Yuzhe You, Jian Zhao.
Exploring Comparative Visual Approaches for Understanding Model Trade-offs in Adversarial Machine Learning. Proceedings of the Graphics Interface Conference, 2025 (In Press).
[C50]
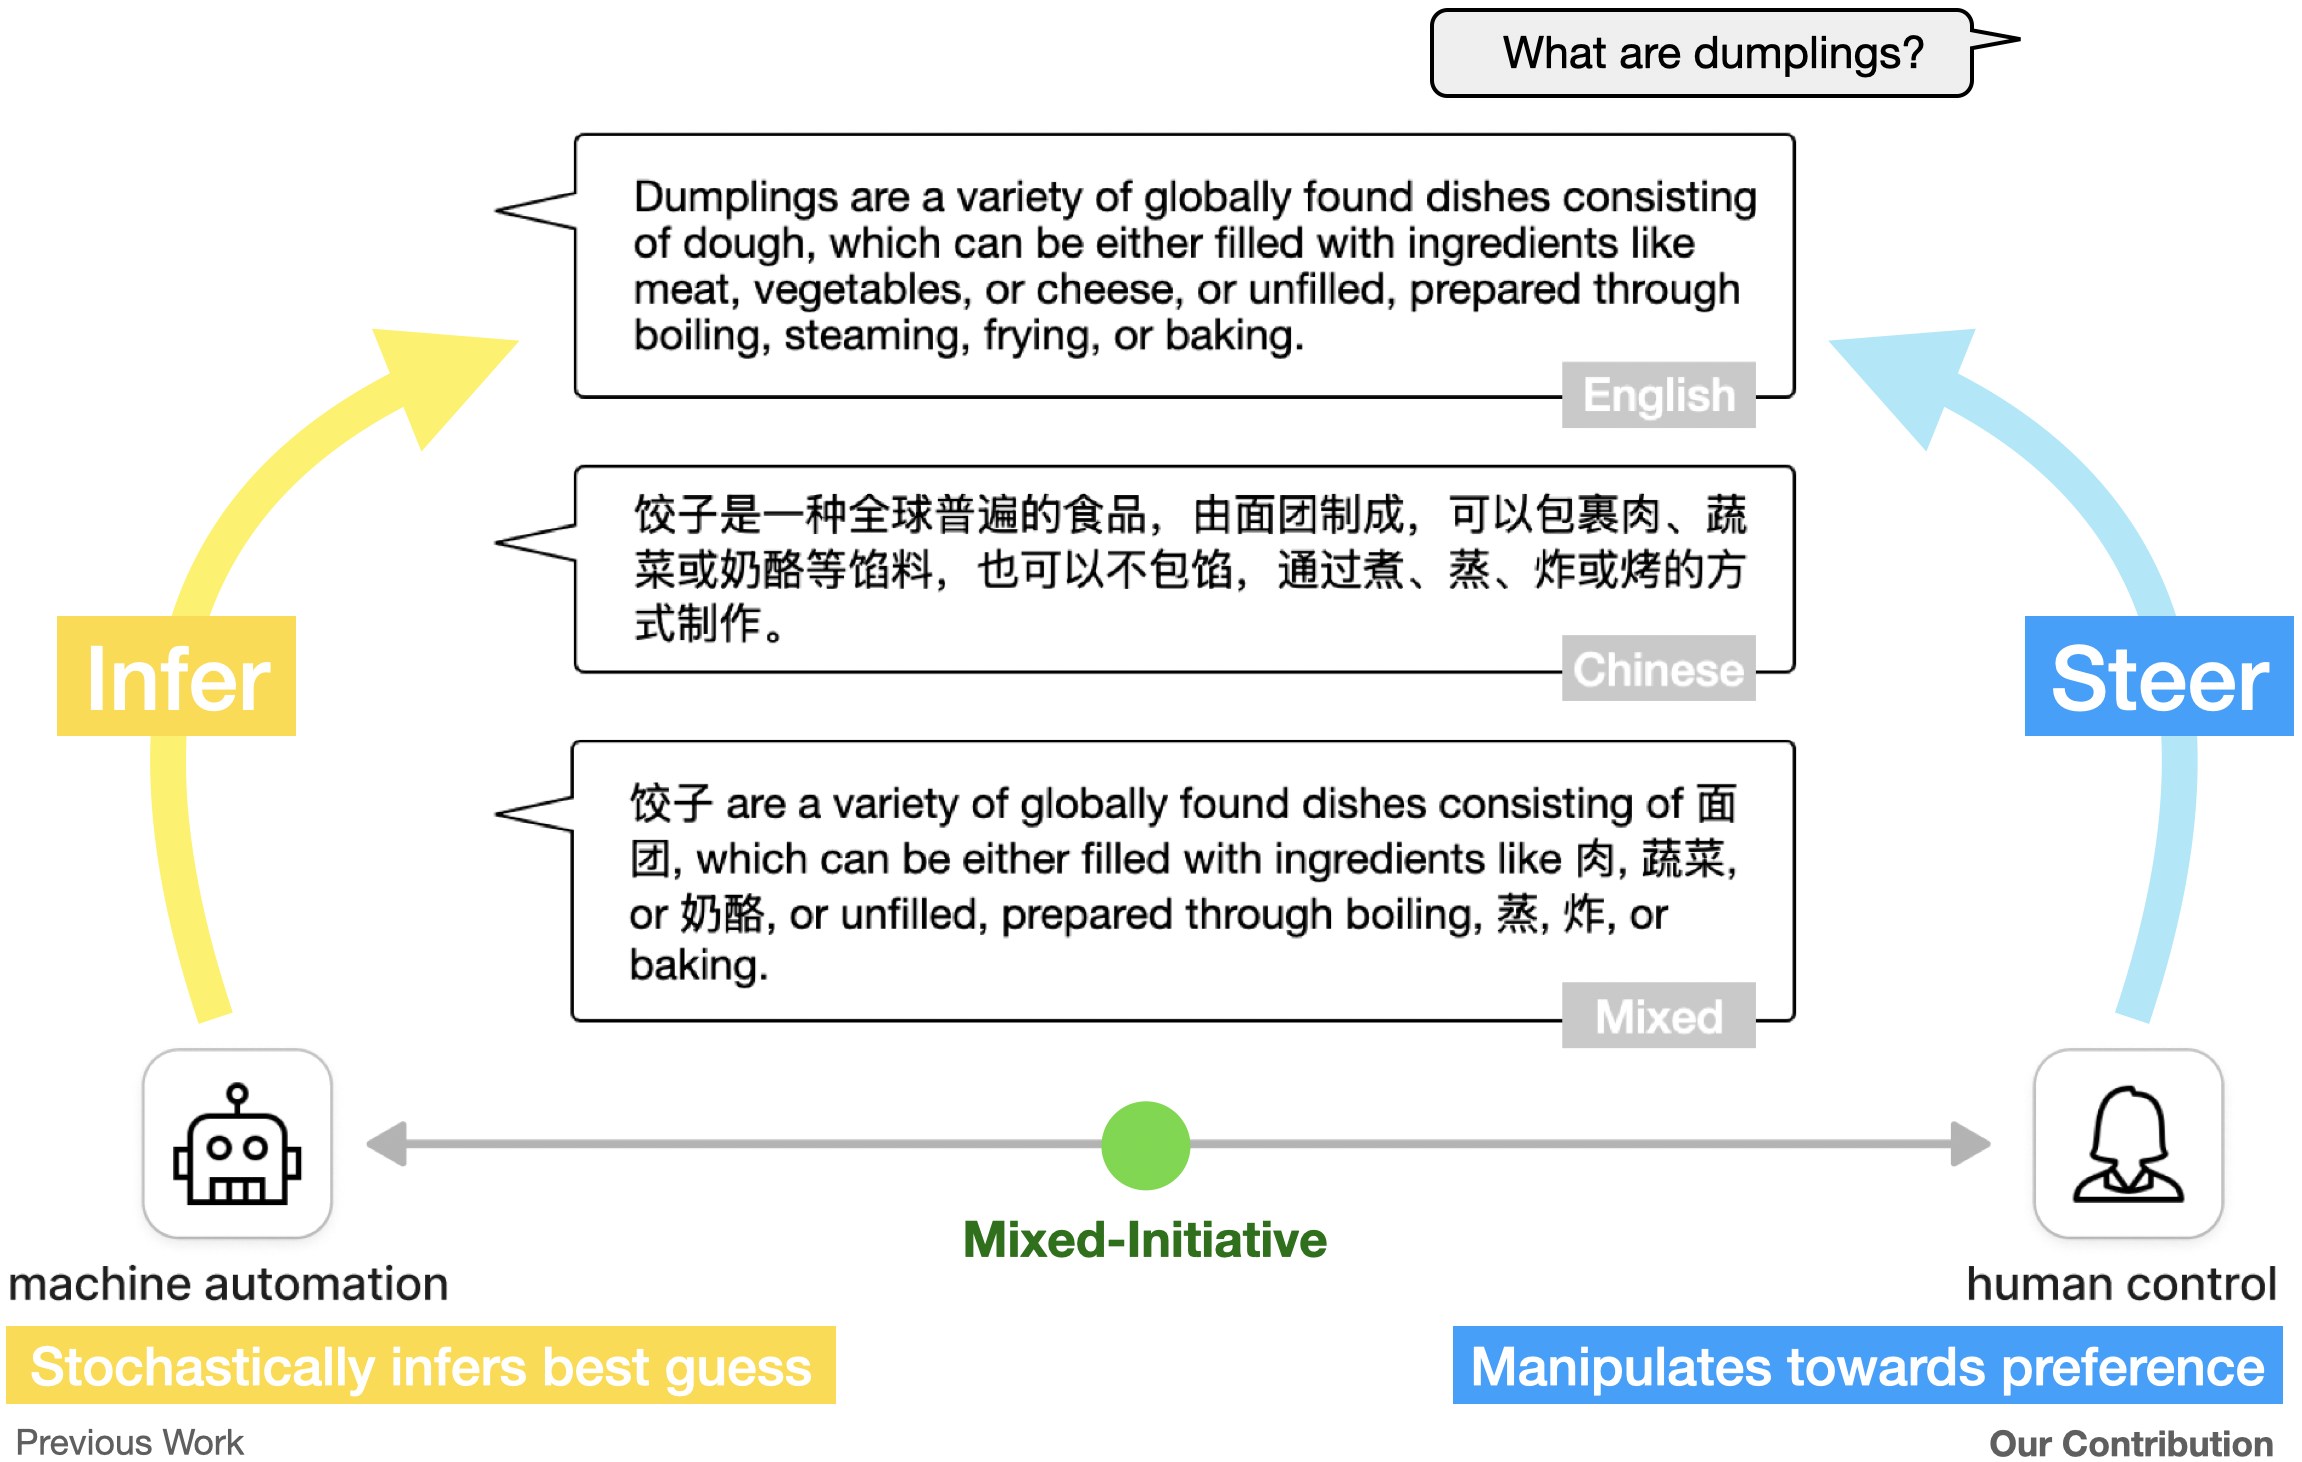
Jiawen Stefanie Zhu, Jian Zhao.
What is Jiaozi: Exploring User Control of Language Style in Multilingual Conversational Agents. Proceedings of the Graphics Interface Conference, 2025 (In Press).
[C49]
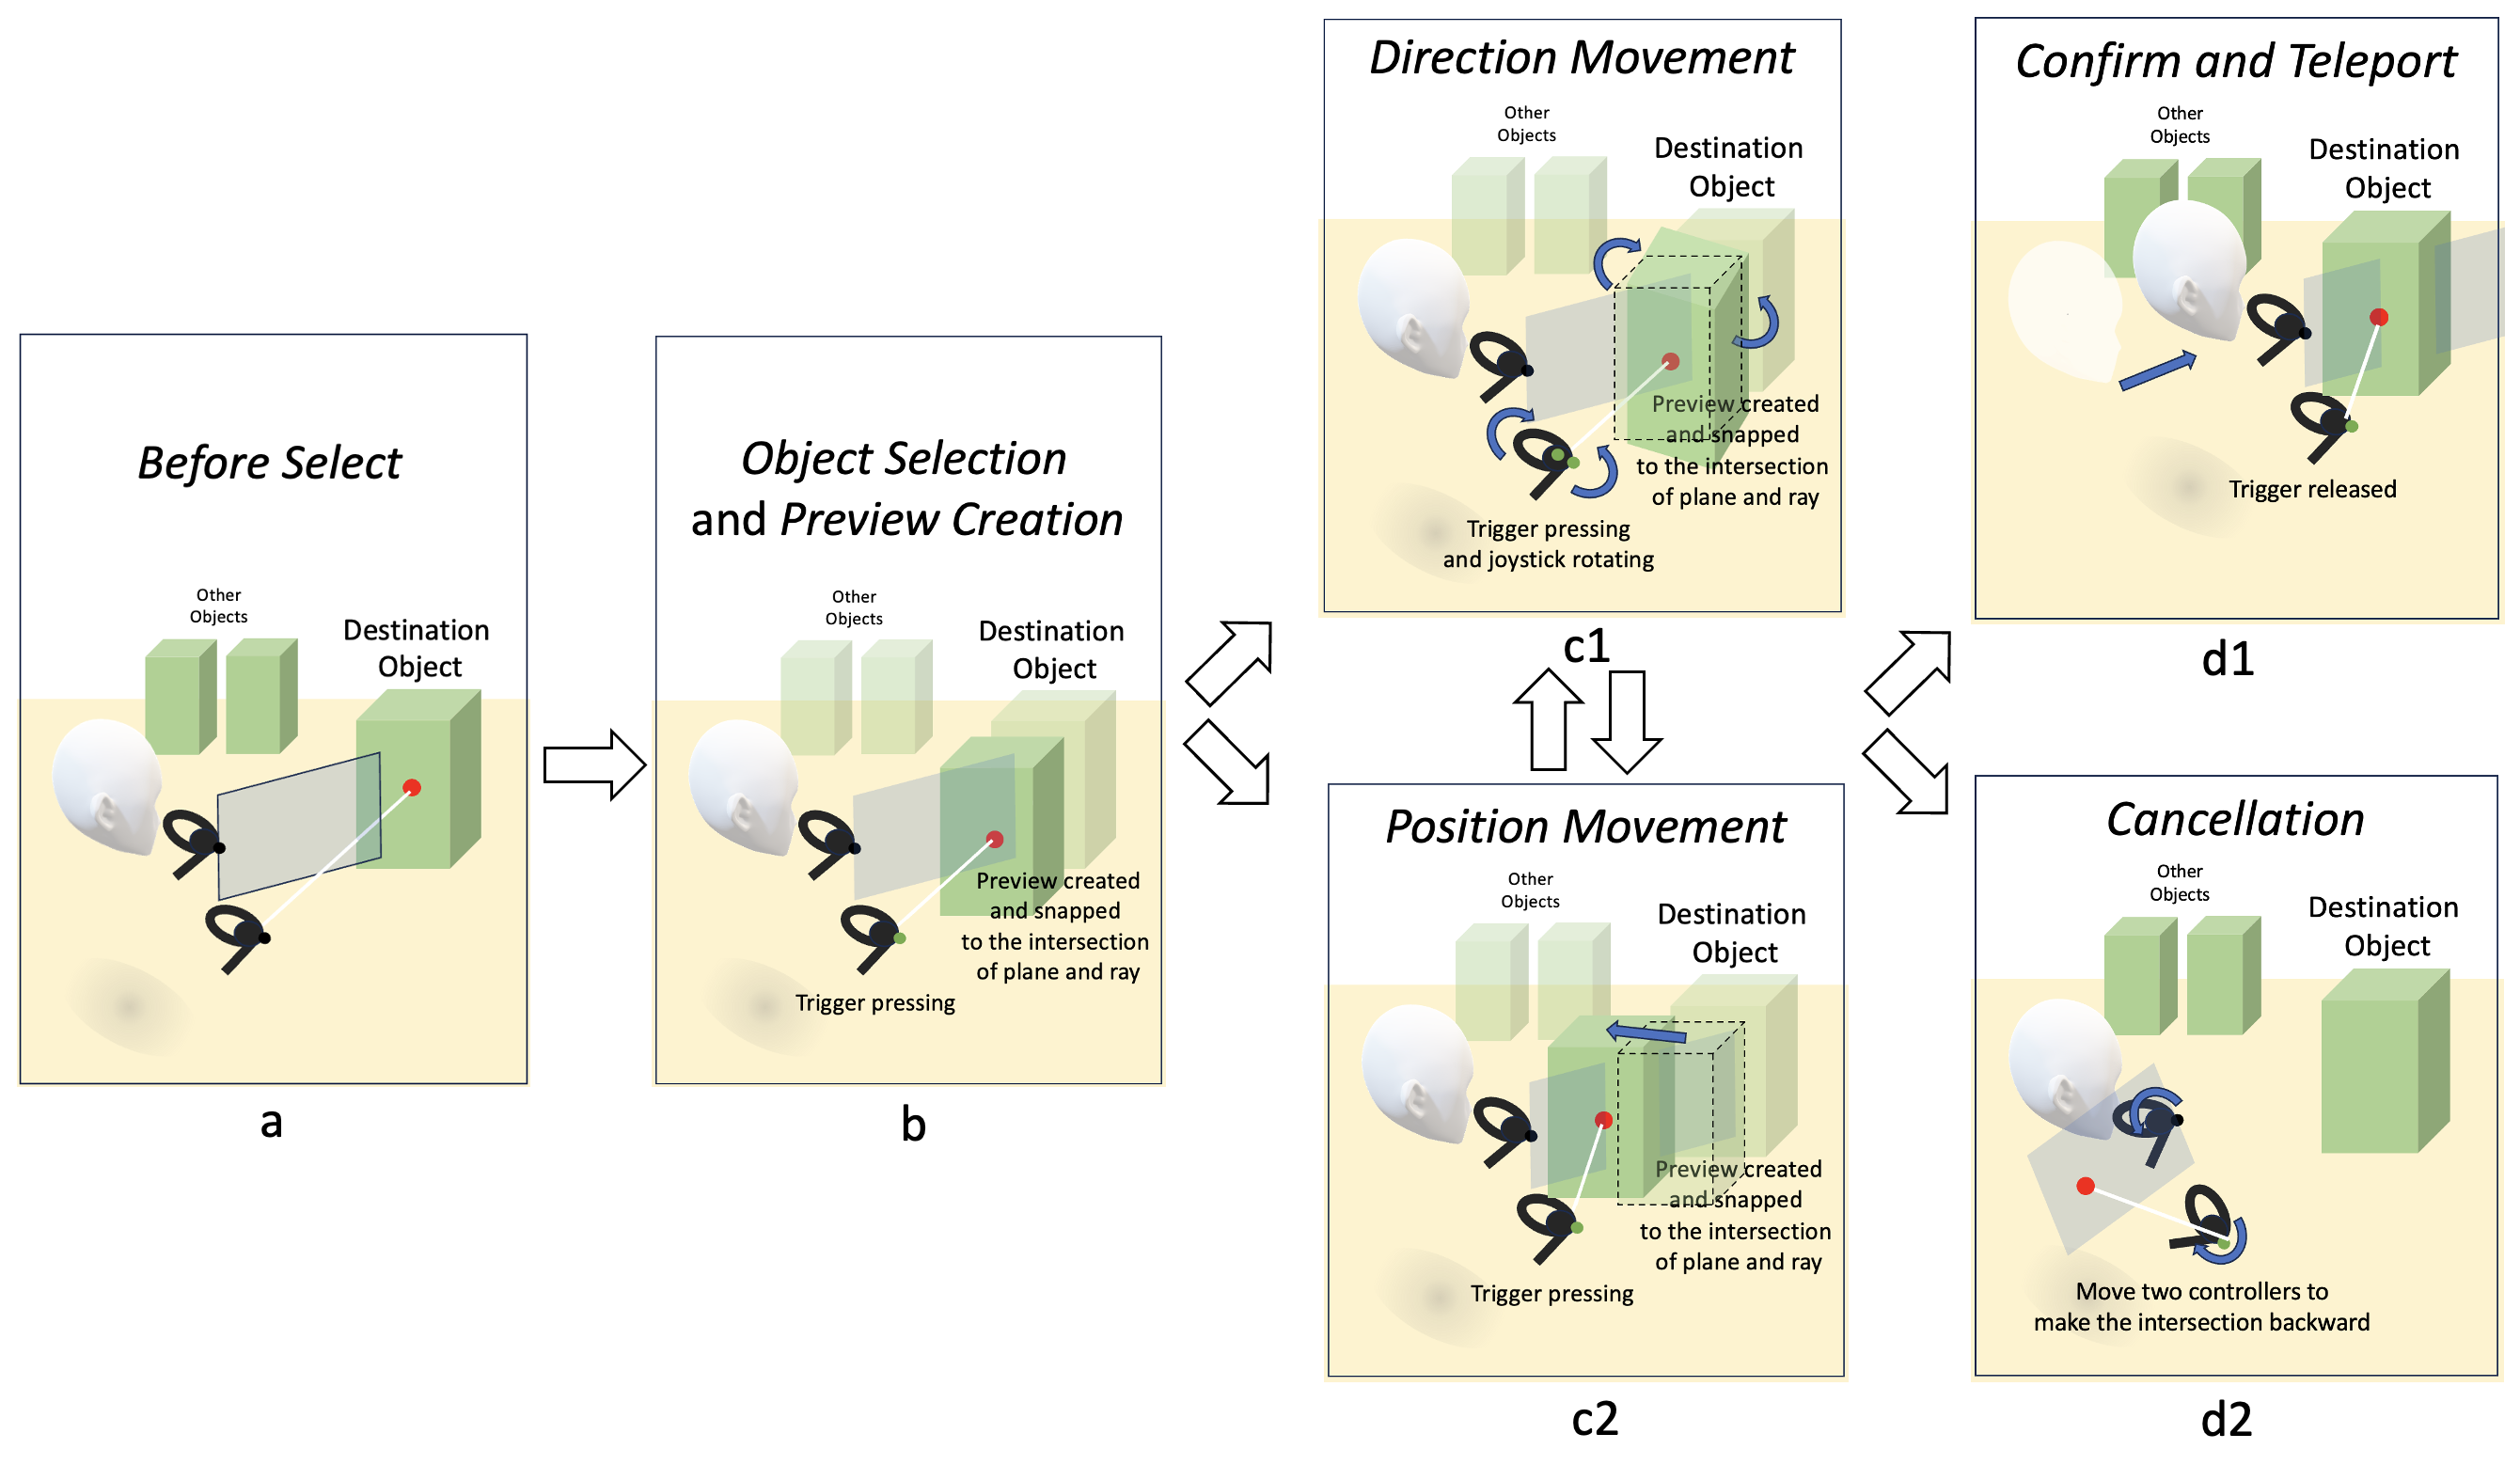
Futian Zhang, Jiawen Stefanie Zhu, Edward Lank, Keiko Katsuragawa, Jian Zhao.
Fly the Moon to Me: Bimanual 3D Locomotion in Virtual Reality By Manipulating the Position of the Destination Object. Proceedings of the Graphics Interface Conference, 2025 (In Press).
[C48]
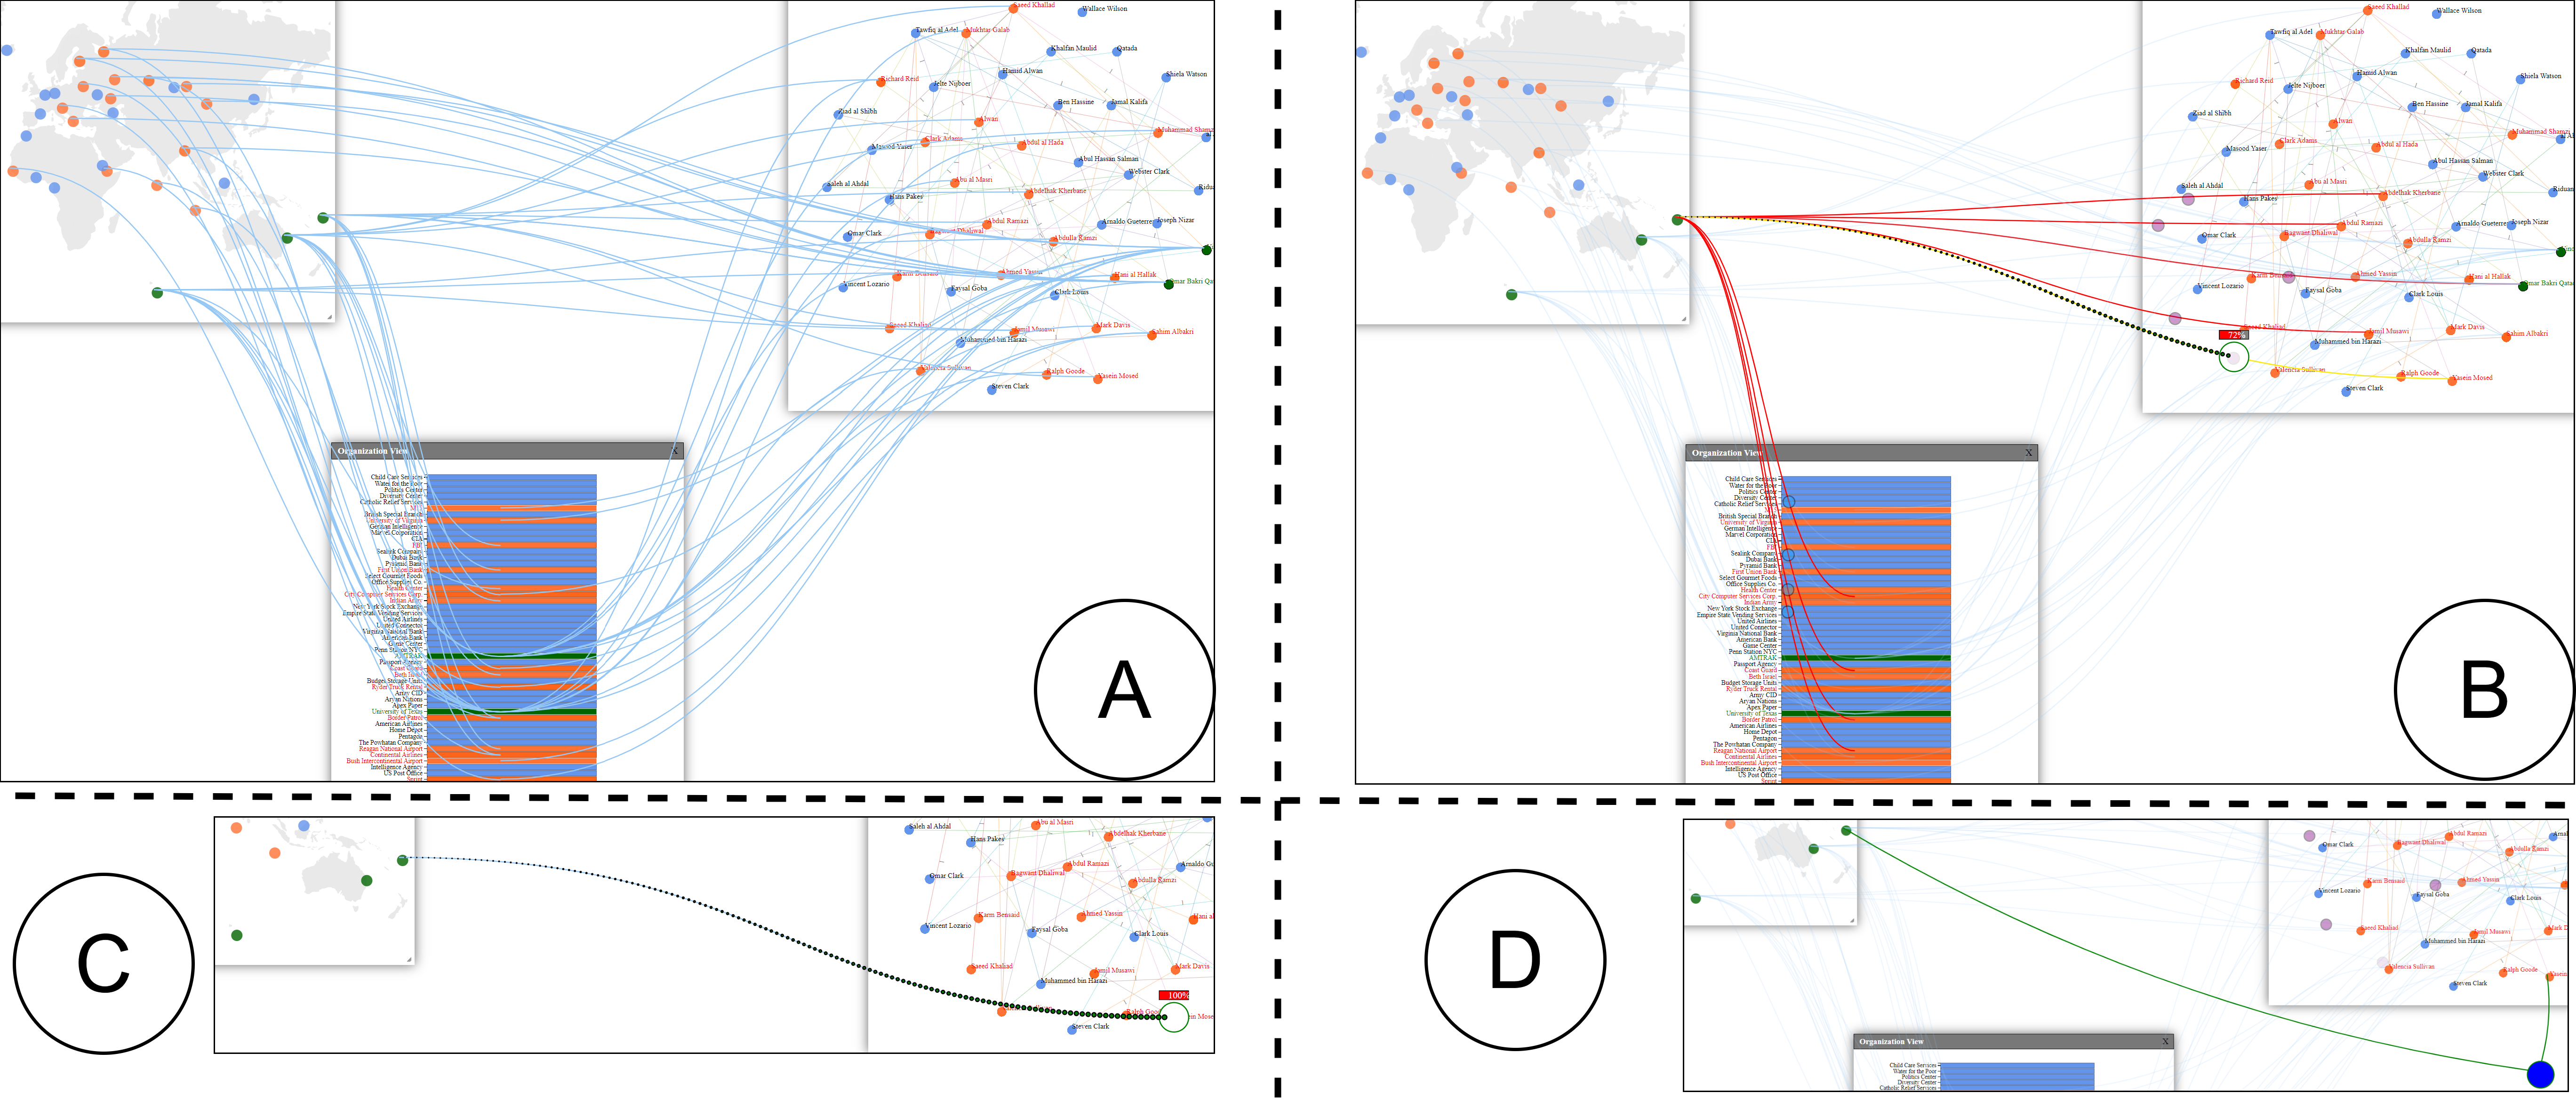
Abdul Rahman Shaikh, Maoyuan Sun, Xingcheng Liu, Hamed Alhoori, Jian Zhao, David Koop.
iTrace: Interactive tracing of Cross-View Data Relationships. Proceedings of the Graphics Interface Conference, 2025 (In Press).
[C47]
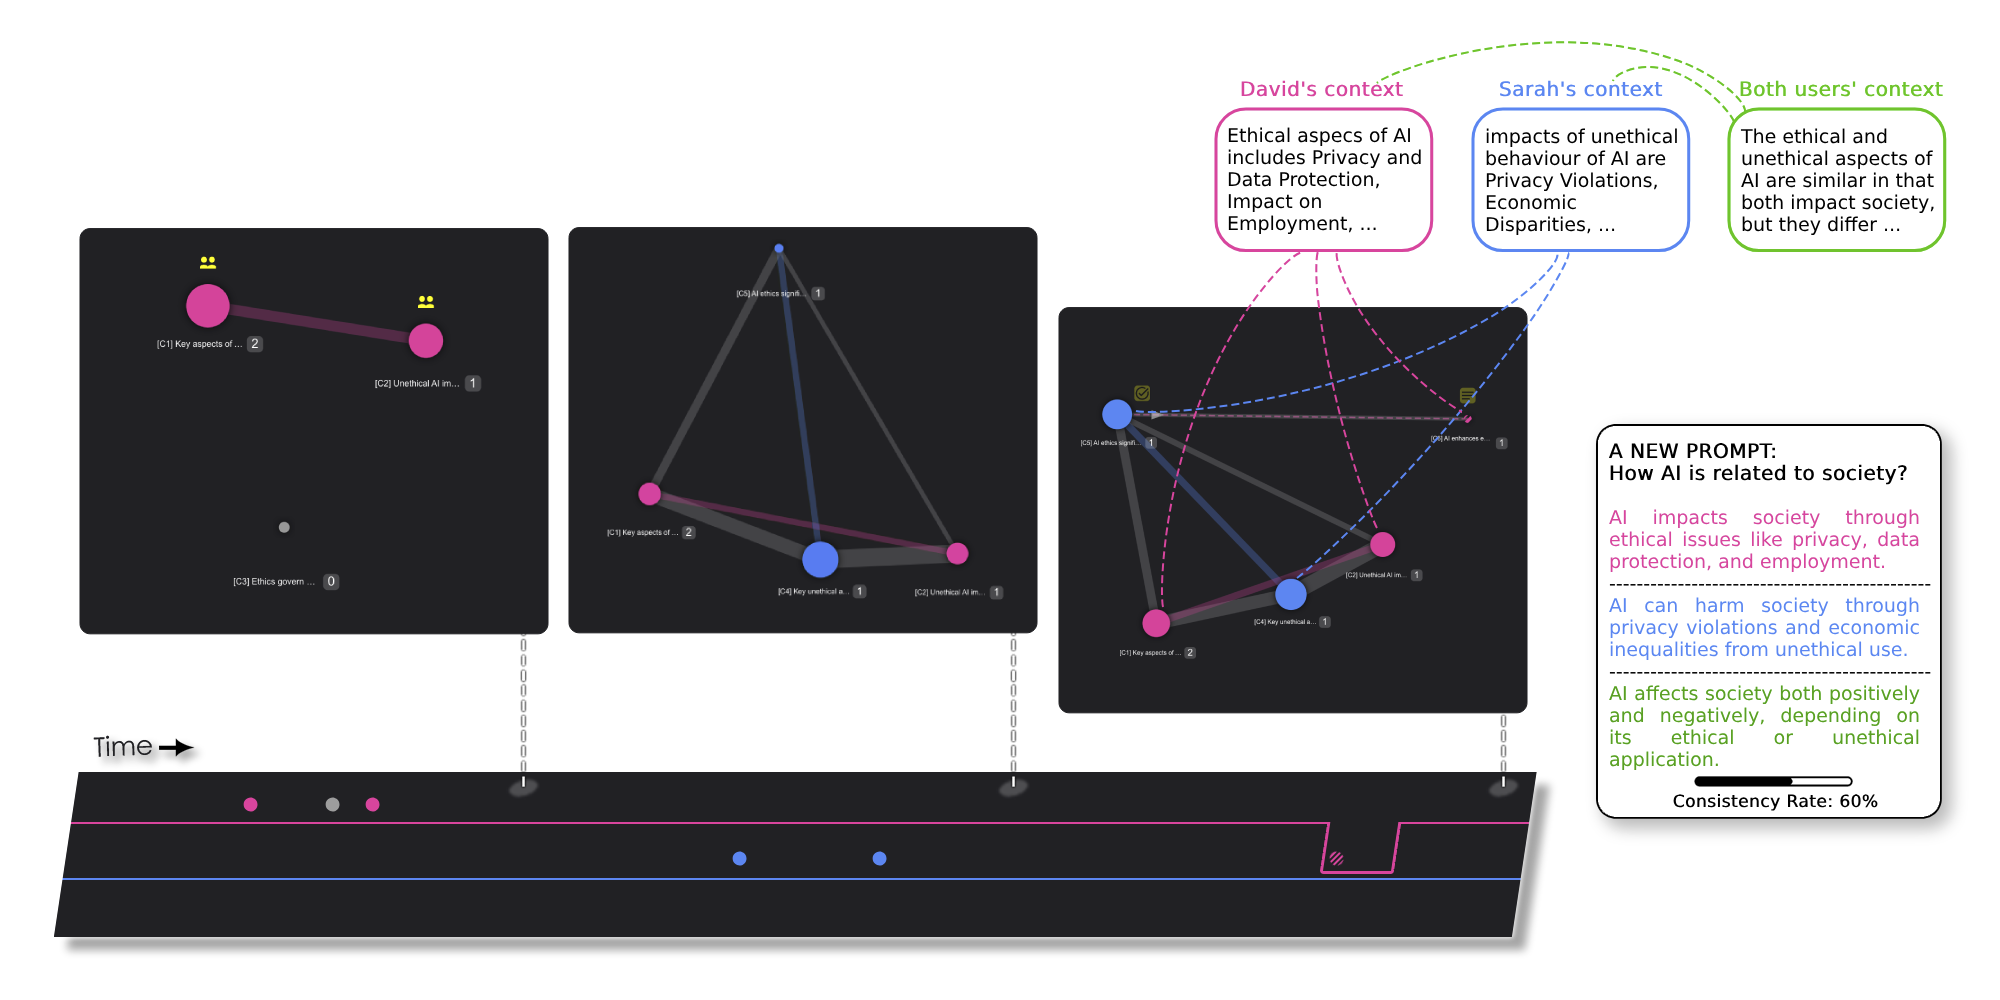
Mohammad Hasan Payandeh, Jian Zhao.
SenseSync: Supporting Collaborative Information-Seeking with the Involvement of Large Language Models. Proceedings of the Graphics Interface Conference, 2025 (In Press).
[C46]
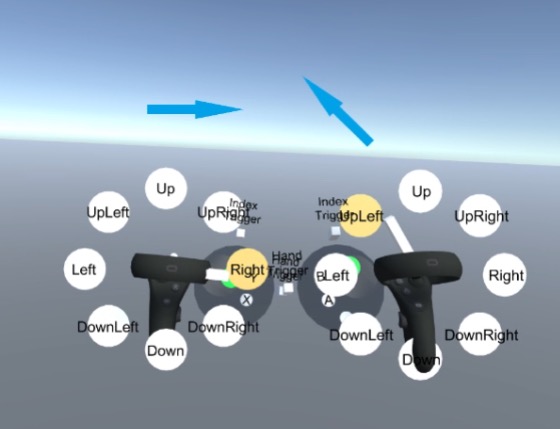
Futian Zhang, Paul Kokhanov, Edward Lank, Keiko Katsuragawa, Jian Zhao.
Drum Menu: Bimanual Controller Command Access Techniques in Virtual Reality. Proceedings of the Graphics Interface Conference, 2025 (In Press).
[C45]
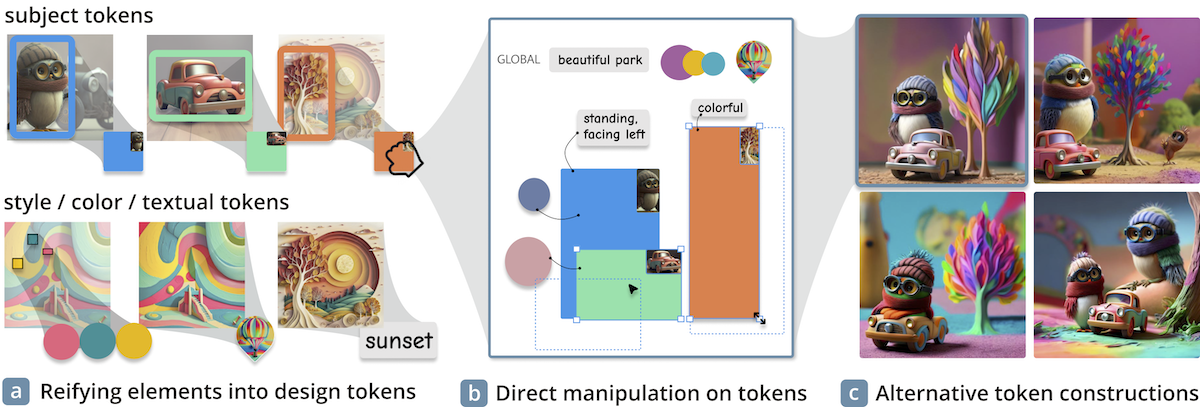
Xinyu Shi, Yinghou Wang, Ryan Rossi, Jian Zhao.
Brickify: Enabling Expressive Design Intent Specification through Direct Manipulation on Design Tokens. Proceedings of the ACM SIGCHI Conference on Human Factors in Computing Systems, pp. 424:1-424:20, 2025.
[C44]
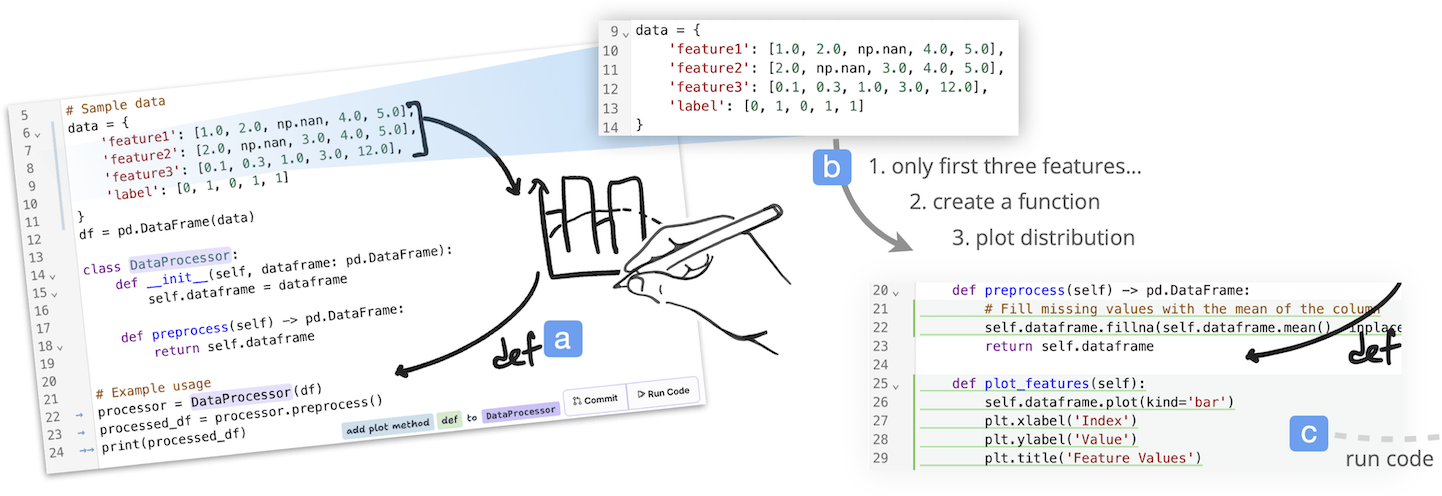
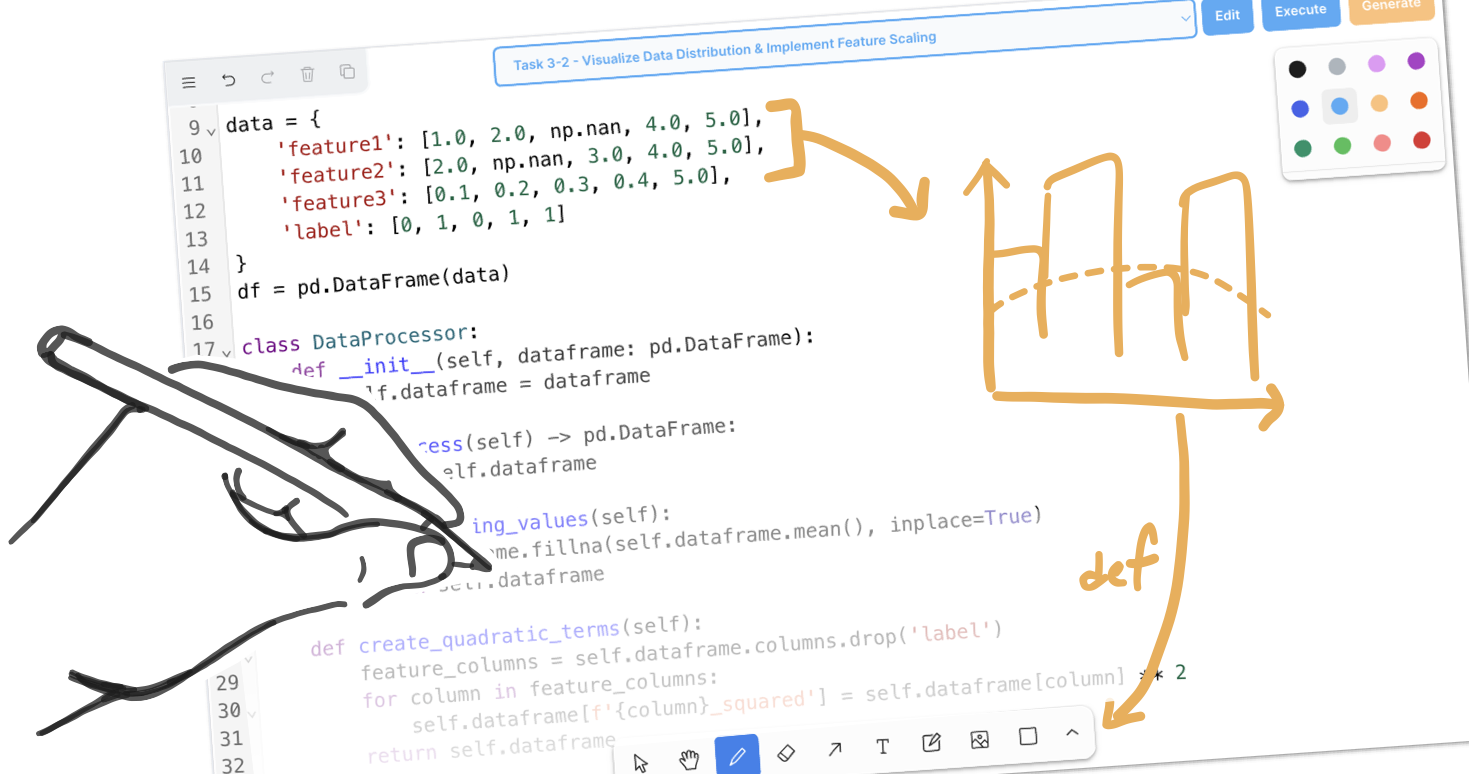
Ryan Yen, Jian Zhao, Daniel Vogel.
Code Shaping: Iterative Code Editing with Free-form AI-Interpreted Sketching. Proceedings of the ACM SIGCHI Conference on Human Factors in Computing Systems, pp. 872:1-872:17, 2025.
[C43]
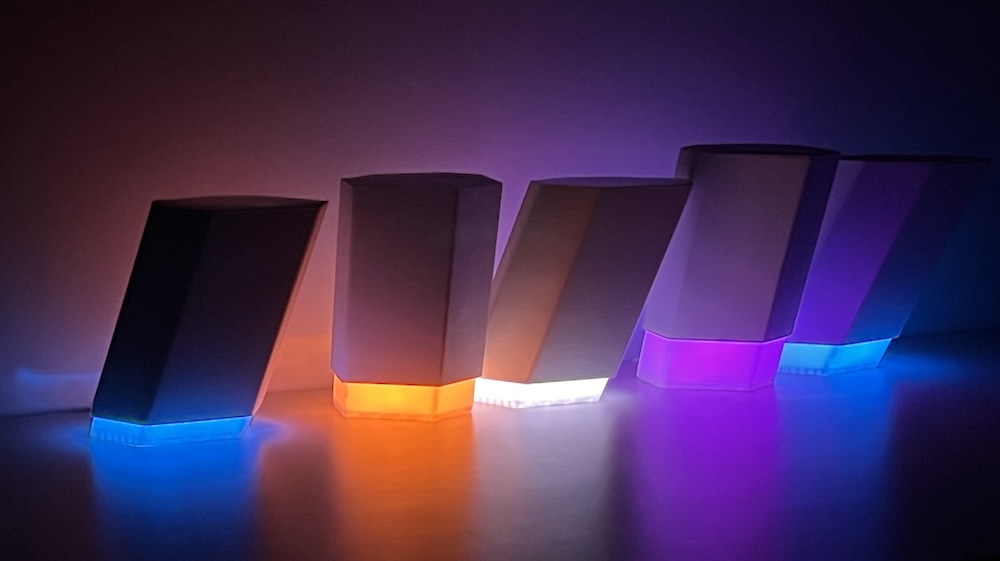
Ce Zhong, Xiang Li, Xizi Wang, Junwei Sun, Jian Zhao.
Investigating Composite Relation with a Data-Physicalized Thing through the Deployment of the WavData Lamp. Proceedings of the ACM SIGCHI Conference on Human Factors in Computing Systems, pp. 763:1-763:21, 2025.
[C42]
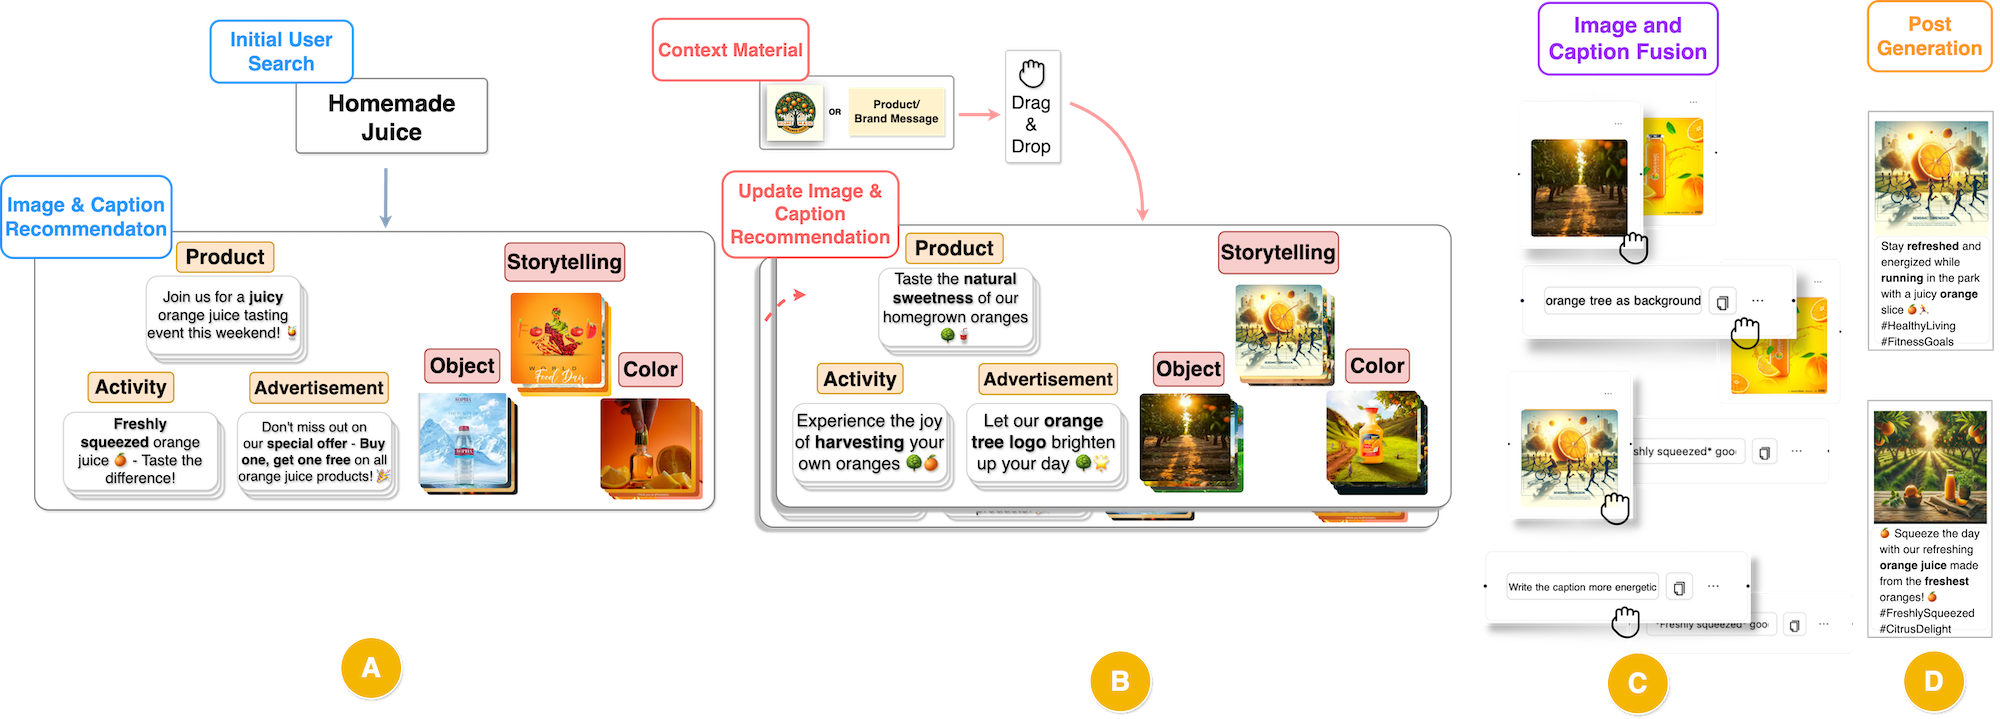
Xuye Liu, Annie Sun, Pengcheng An, Tengfei Ma, Jian Zhao.
Influencer: Empowering Everyday Users in Creating Promotional Posts via AI-infused Exploration and Customization. Proceedings of the ACM SIGCHI Conference on Human Factors in Computing Systems, pp. 1004:1-1004:19, 2025.
[C41]
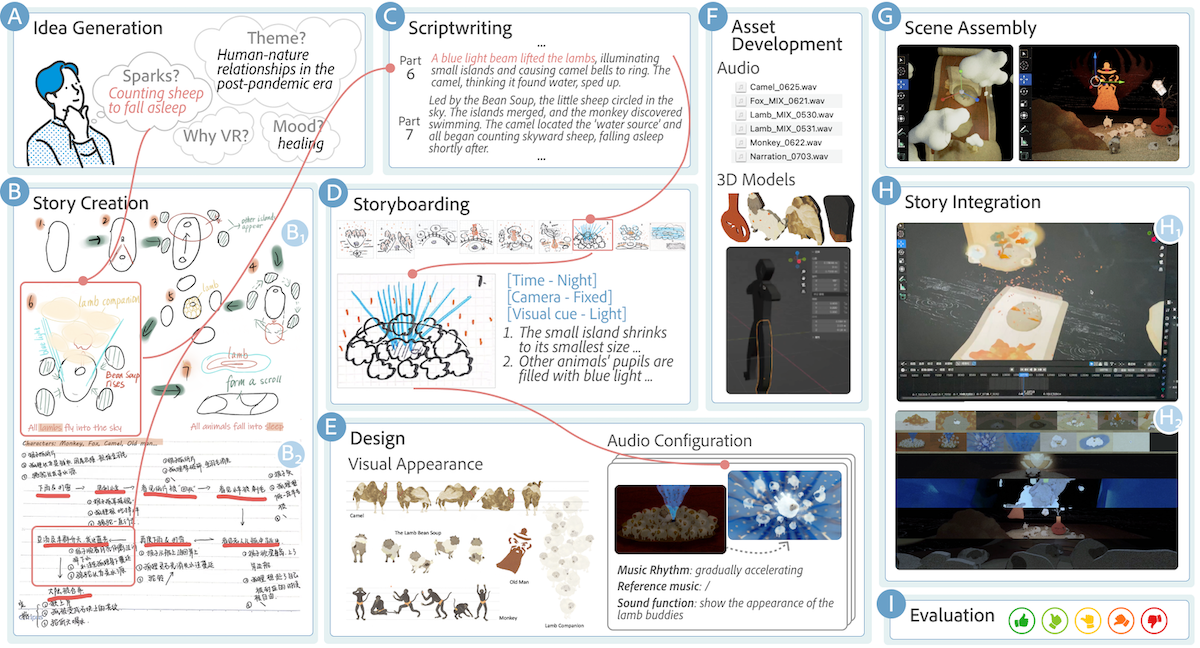
Linping Yuan, Feilin Han, Liwenhan Xie, Junjie Zhang, Jian Zhao, Huamin Qu.
You'll Be Alice Adventuring in Wonderland! Processes, Challenges, and Opportunities of Creating Animated Virtual Reality Stories. Proceedings of the ACM SIGCHI Conference on Human Factors in Computing Systems, pp. 193:1-193:21, 2025.
[C40]
Boda Li, Minghao Li, Jian Zhao, Wei Cai.
PartFlow: A Visualization Tool for Application Partitioning and Workload Offloading in Mobile Edge Computing. Proceedings of the IEEE Pacific Visualization Conference, pp. 108-117, 2025.
[W23]
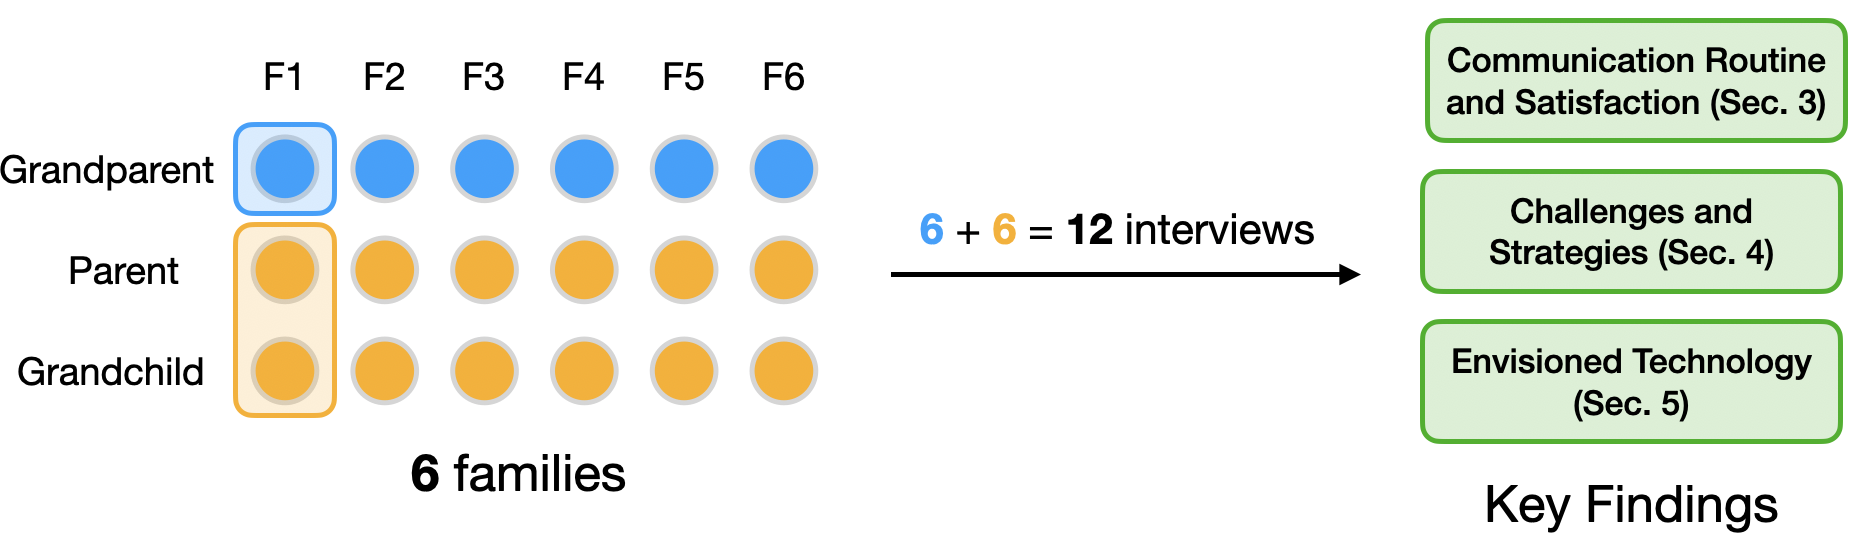
Jiawen Stefanie Zhu, Jian Zhao.
Understanding Remote Communication between Grandparents and Grandchildren in Distributed Immigrant Families. Proceedings of the Graphics Interface Conference (Poster), 2025.
[W22]
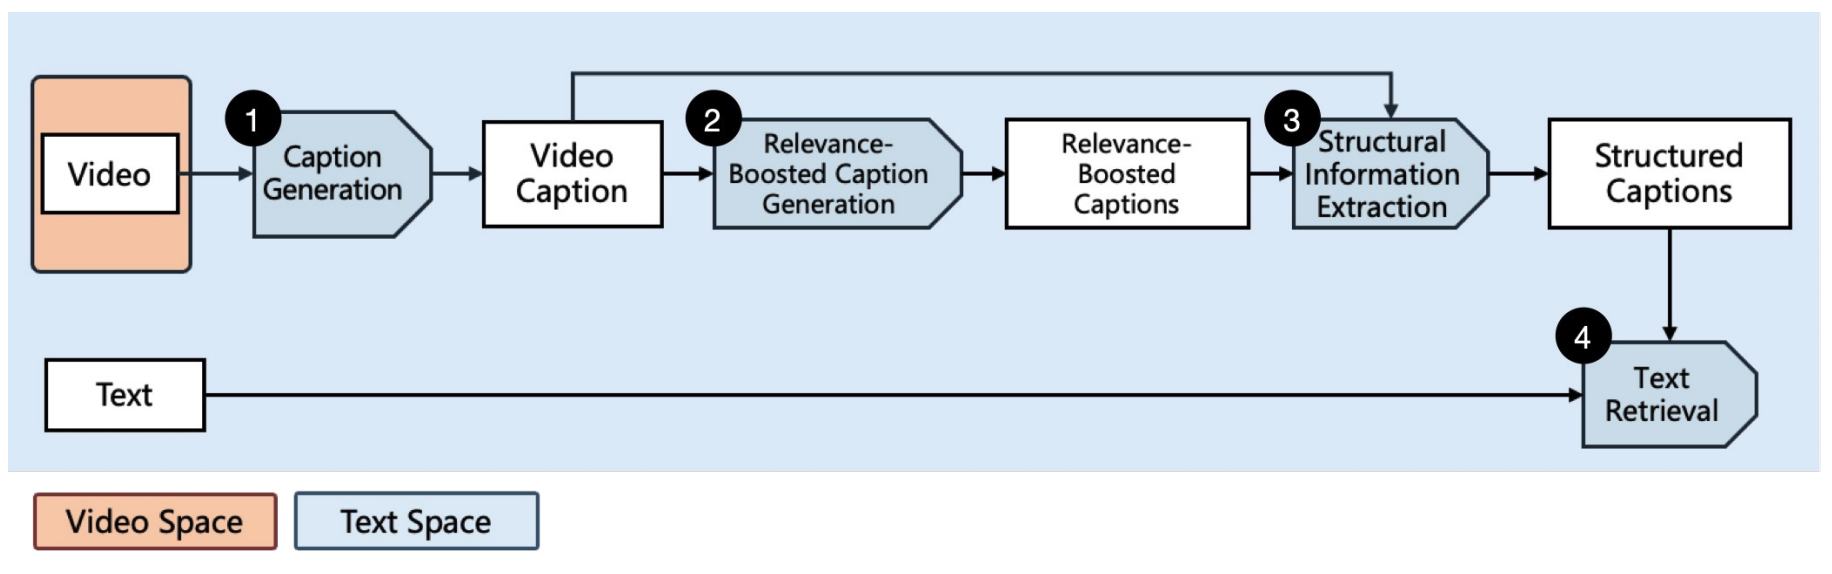
Xuye Liu, Yimu Wang, Jian Zhao.
ELIOT: Zero-Shot Video-Text Retrieval through Relevance-Boosted Captioning and Structural Information Extraction. Proceedings of the Annual Conference of the Nations of the Americas Chapter of the Association for Computational Linguistics (Student Research Workshop), 4, pp. 381-391, 2025.
[W21]
Xuye Liu, Tengfei Ma, Yimu Wang, Fengjie Wang, Jian Zhao.
SENTIENT: A Dataset for Describing Code and Table Outputs under User-Specified Guidelines in Computational Notebooks. Proceedings of the Annual Conference of the Nations of the Americas Chapter of the Association for Computational Linguistics (Student Research Workshop), 2025.
[W20]
Xinyu Shi, Shunan Guo, Jane Hoffswell, Gromit Yeuk-Yin Chan, Victor S. Bursztyn, Jian Zhao, Eunyee Koh.
Comprehensive Sketching: Exploring Infographic Design Alternatives in Parallel. Extended Abstracts of the CHI Conference on Human Factors in Computing Systems, pp. 145:1-145:8, 2025.
[W19]
Yuzhe You, Helen Weixu Chen, Jian Zhao.
Enhancing AI Explainability for Non-technical Users with LLM-Driven Narrative Gamification. Extended Abstracts of the CHI Conference on Human Factors in Computing Systems, pp. 221:1-221:7, 2025.
2024
[J36]
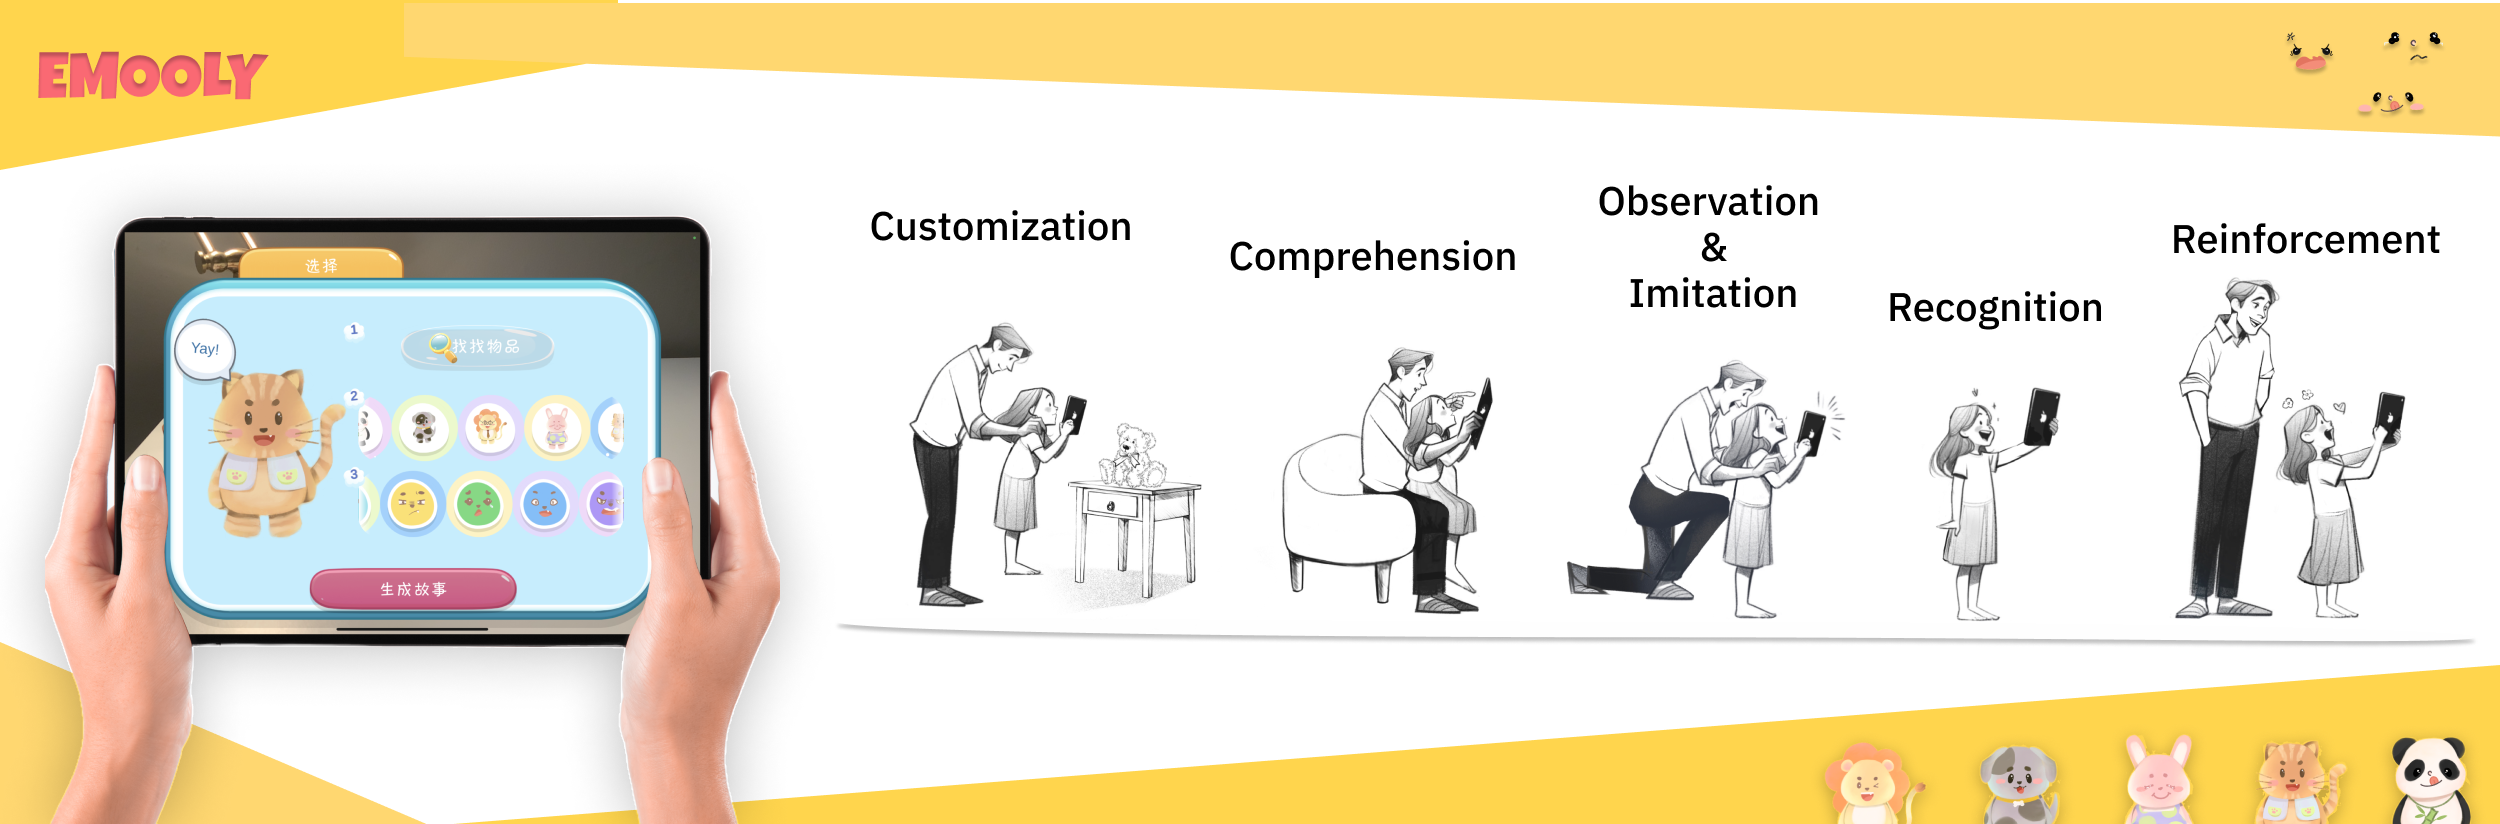
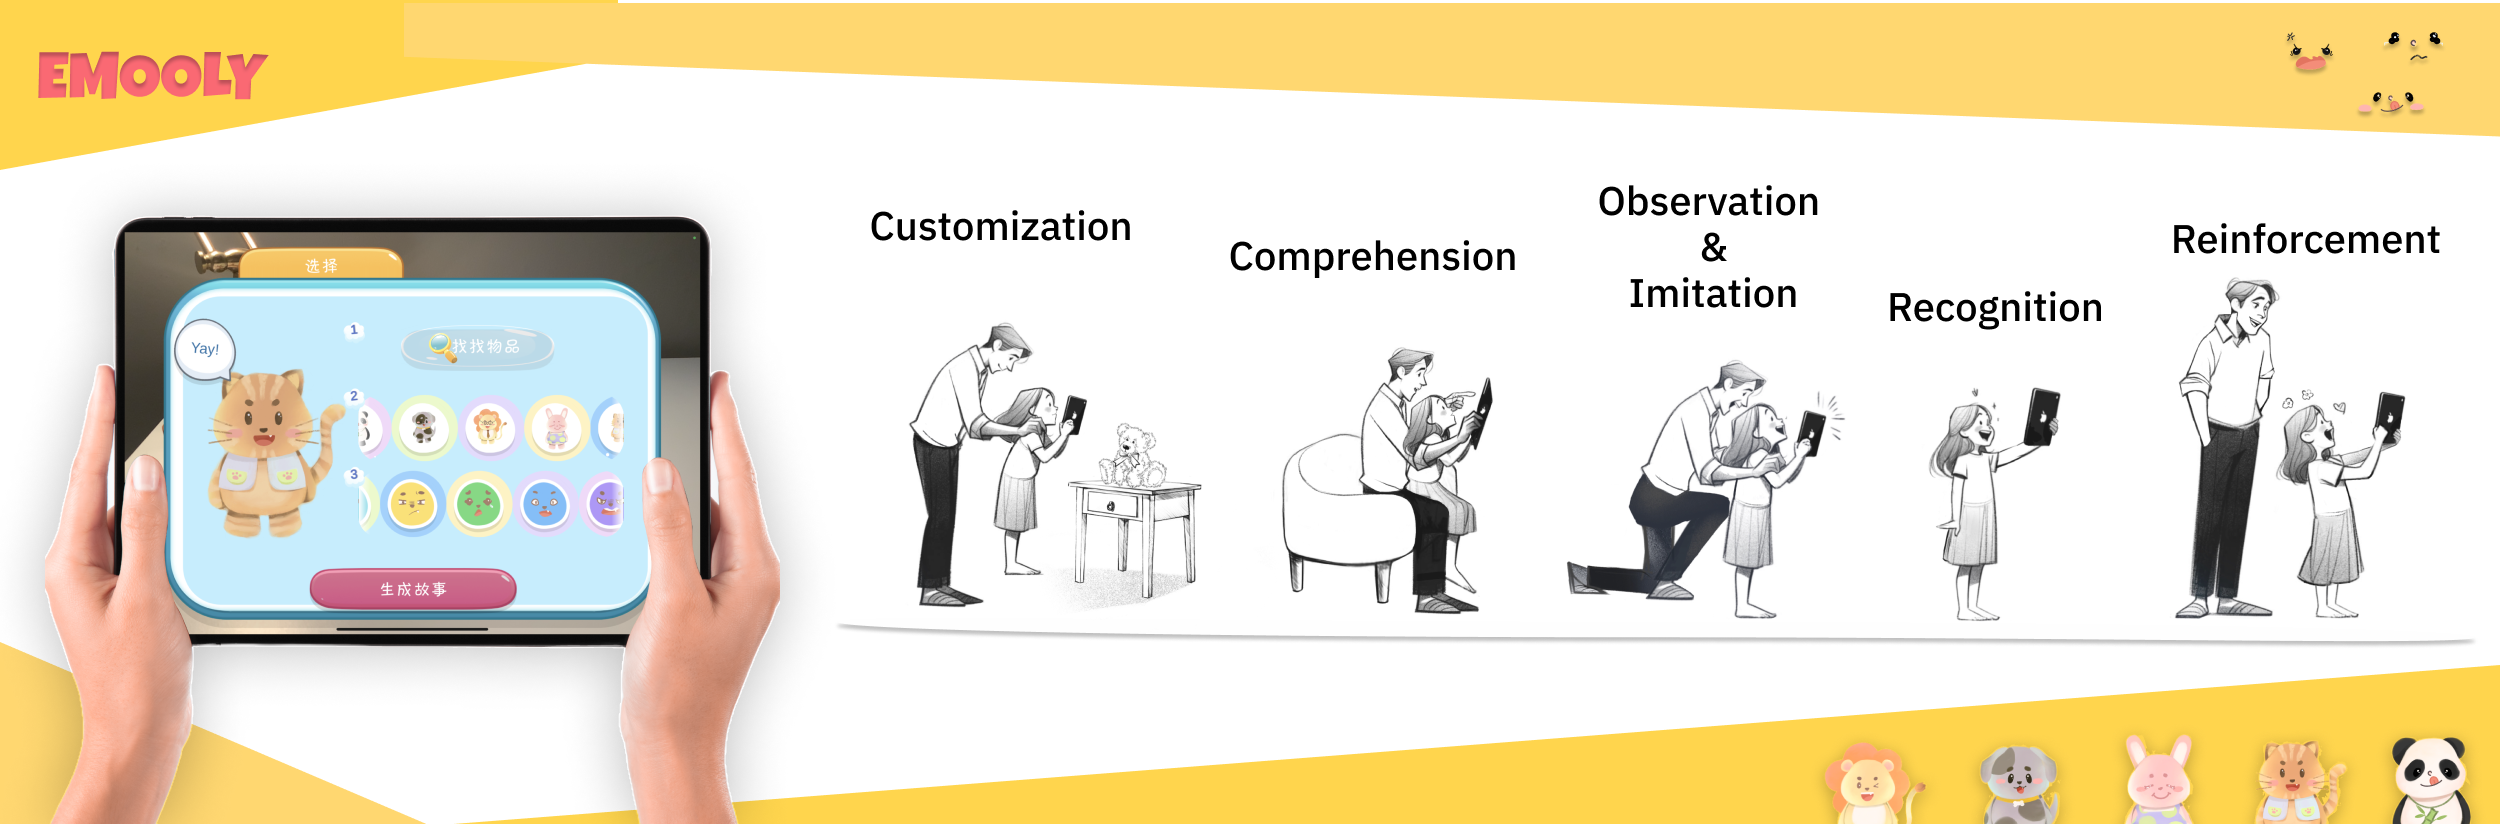
Yue Lyu, Di Liu, Pengcheng An, Xin Tong, Huan Zhang, Keiko Katsuragawa, Jian Zhao.
EMooly: Supporting Autistic Children in Collaborative Social-Emotional Learning with Caregiver Participation through Interactive AI-infused and AR Activities. Proceedings of the ACM on Interactive, Mobile, Wearable and Ubiquitous Technologies, 8(4), pp. 203:1-203:36, 2024.
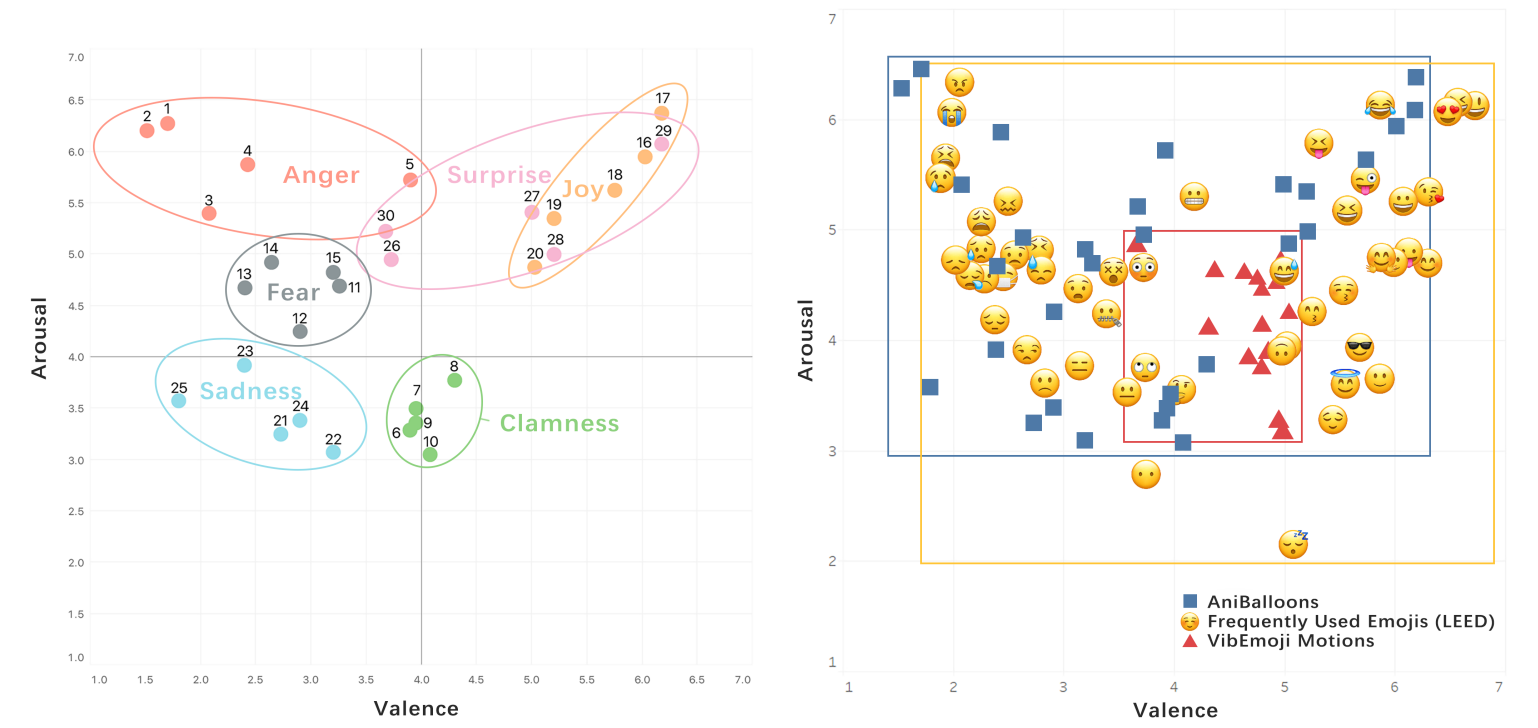
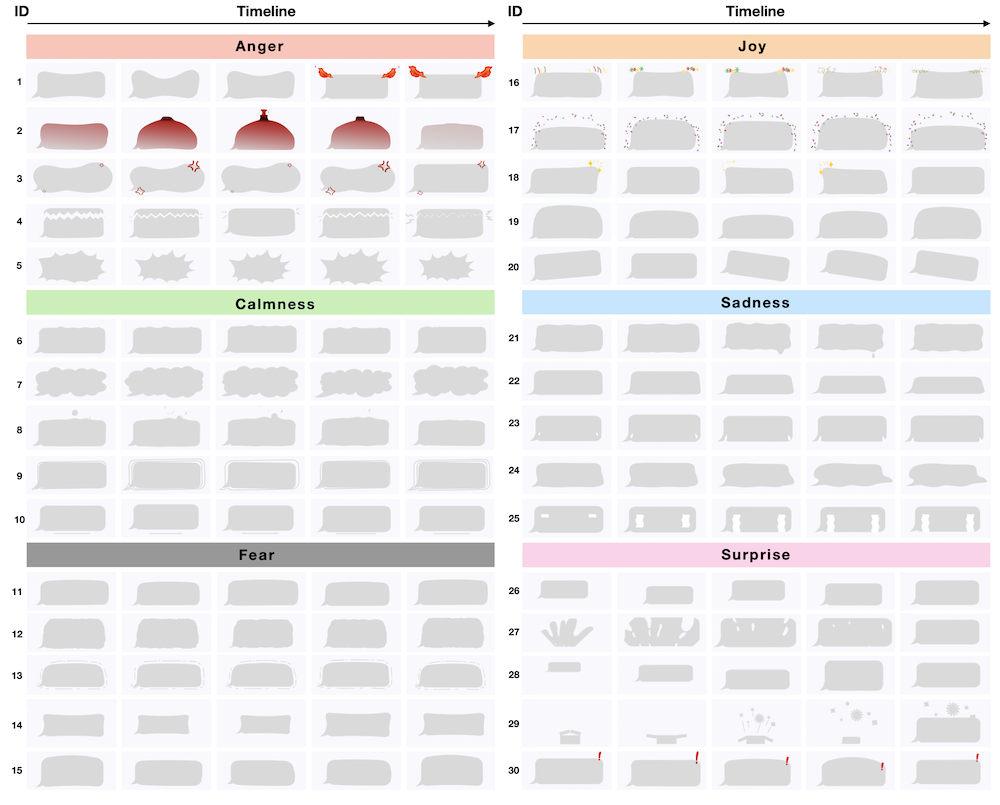
[J35]
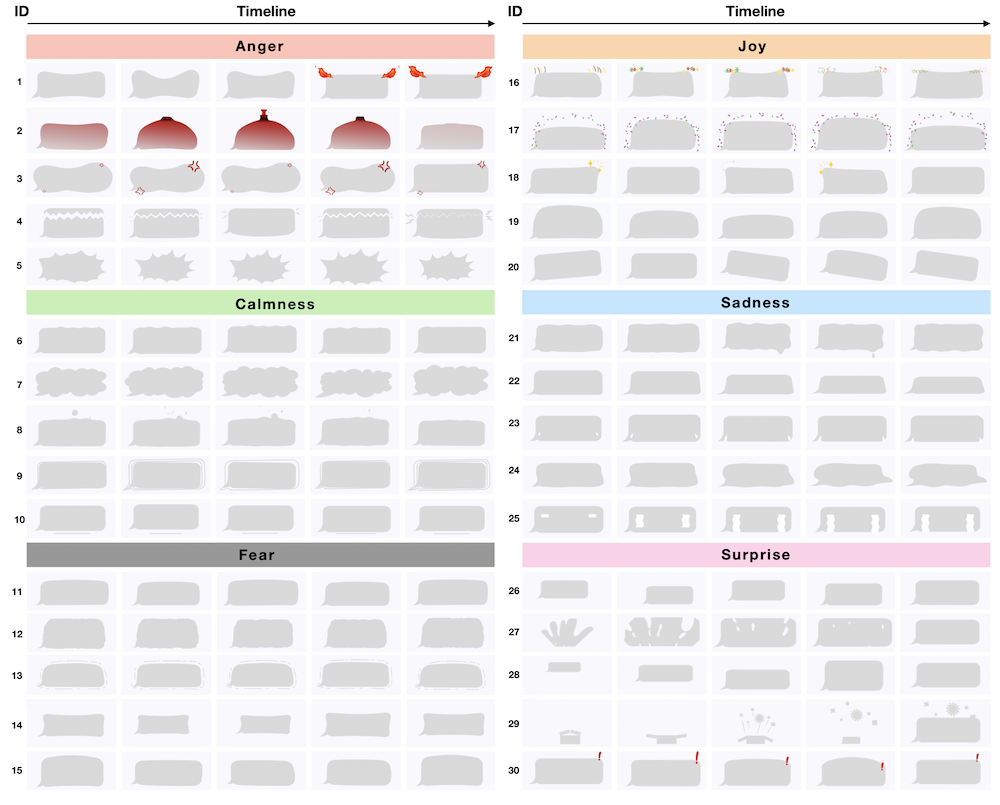
Pengcheng An, Chaoyu Zhang, Haichen Gao, Ziqi Zhou, Yage Xiao, Jian Zhao.
AniBalloons: Animated Chat Balloons as Affective Augmentation for Social Messaging and Chatbot Interaction. International Journal of Human-Computer Studies, 194, pp. 103365:1-103365:16, 2025 (Accepted in 2024).
[J34]
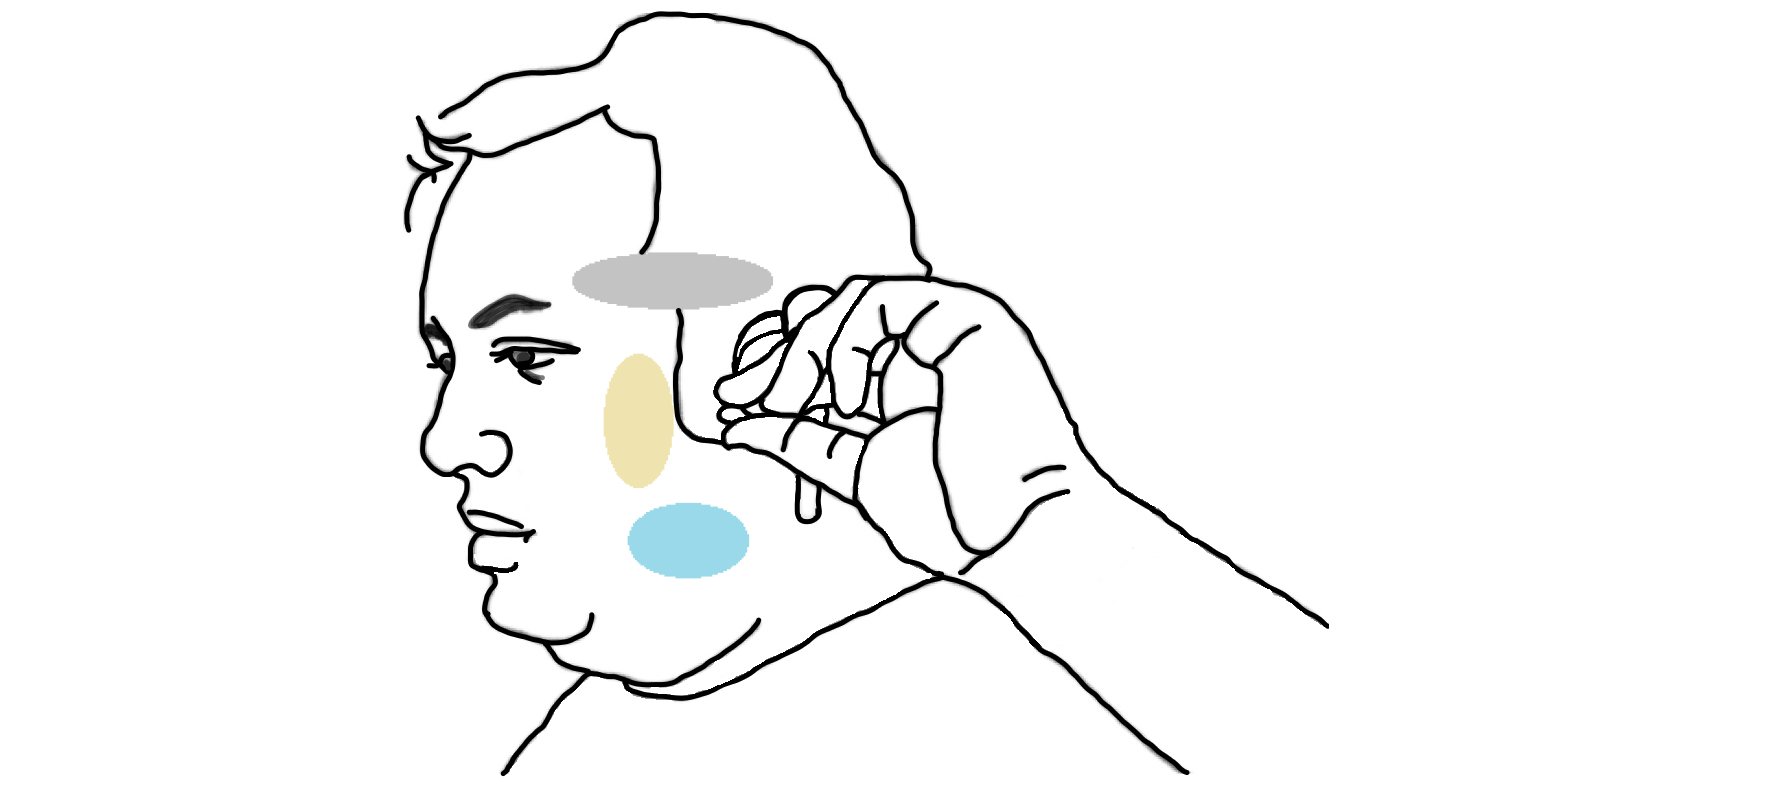
Shaikh Shawon Arefin Shimon, Ali Neshati, Junwei Sun, Qiang Xu, Jian Zhao.
Exploring Uni-manual Around Ear Off-Device Gestures for Earables Proceedings of the ACM on Interactive, Mobile, Wearable and Ubiquitous Technologies, 8(1), pp. 3:1-3:29, 2024.
[C39]
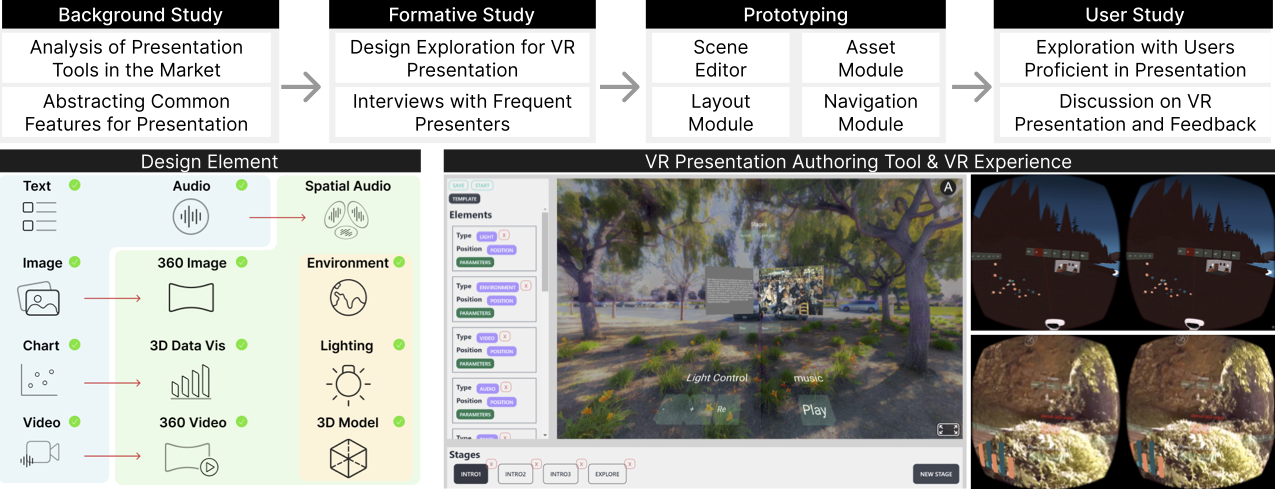
Liwei Wu, Yilin Zhang, Justin Leung, Jingyi Gao, April Li, Jian Zhao.
Planar or Spatial: Exploring Design Aspects and Challenges for Presentations in Virtual Reality with No-coding Interface. Proceedings of the ACM Interactive Surfaces and Spaces Conference, pp. 528:1-528:23, 2024.
[C38]
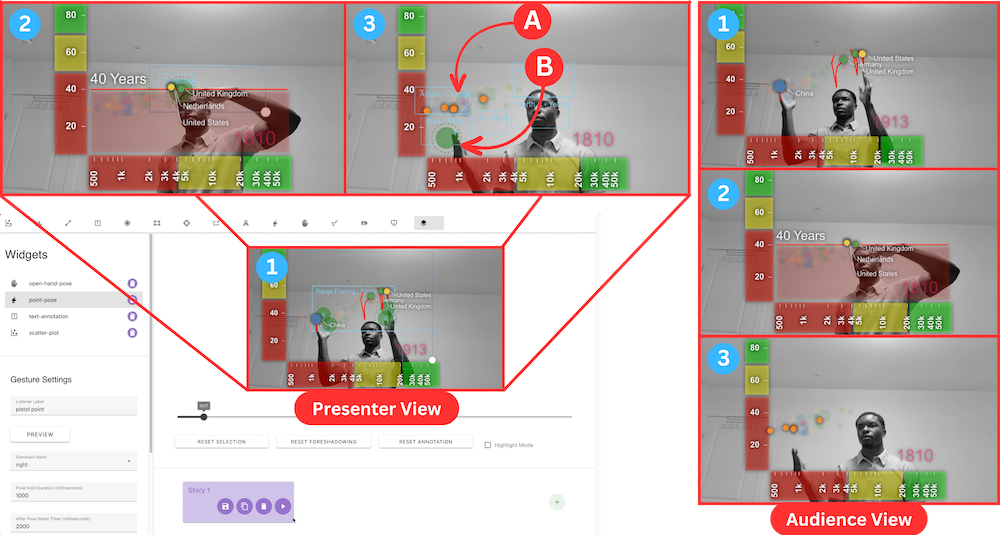
Temiloluwa Paul Femi-Gege, Matthew Brehmer, Jian Zhao.
VisConductor: Affect-Varying Widgets for Animated Data Storytelling in Gesture-Aware Augmented Video Presentation. Proceedings of the ACM Interactive Surfaces and Spaces Conference, pp. 531:1-531:22, 2024.
[C37]
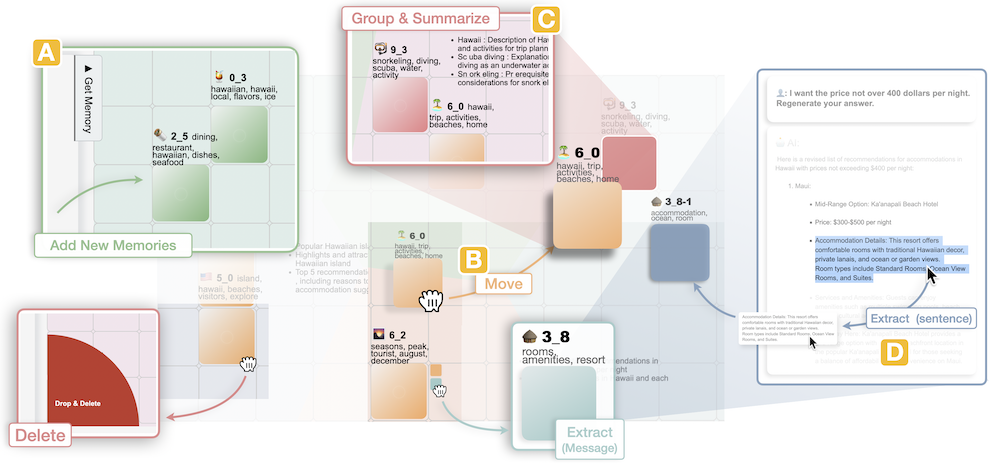
Ryan Yen, Jian Zhao.
Reifying the Reuse of User-AI Conversational Memories. Proceedings of ACM Symposium on User Interface Software and Technology, pp. 58:1-58:22, 2024.
[C36]
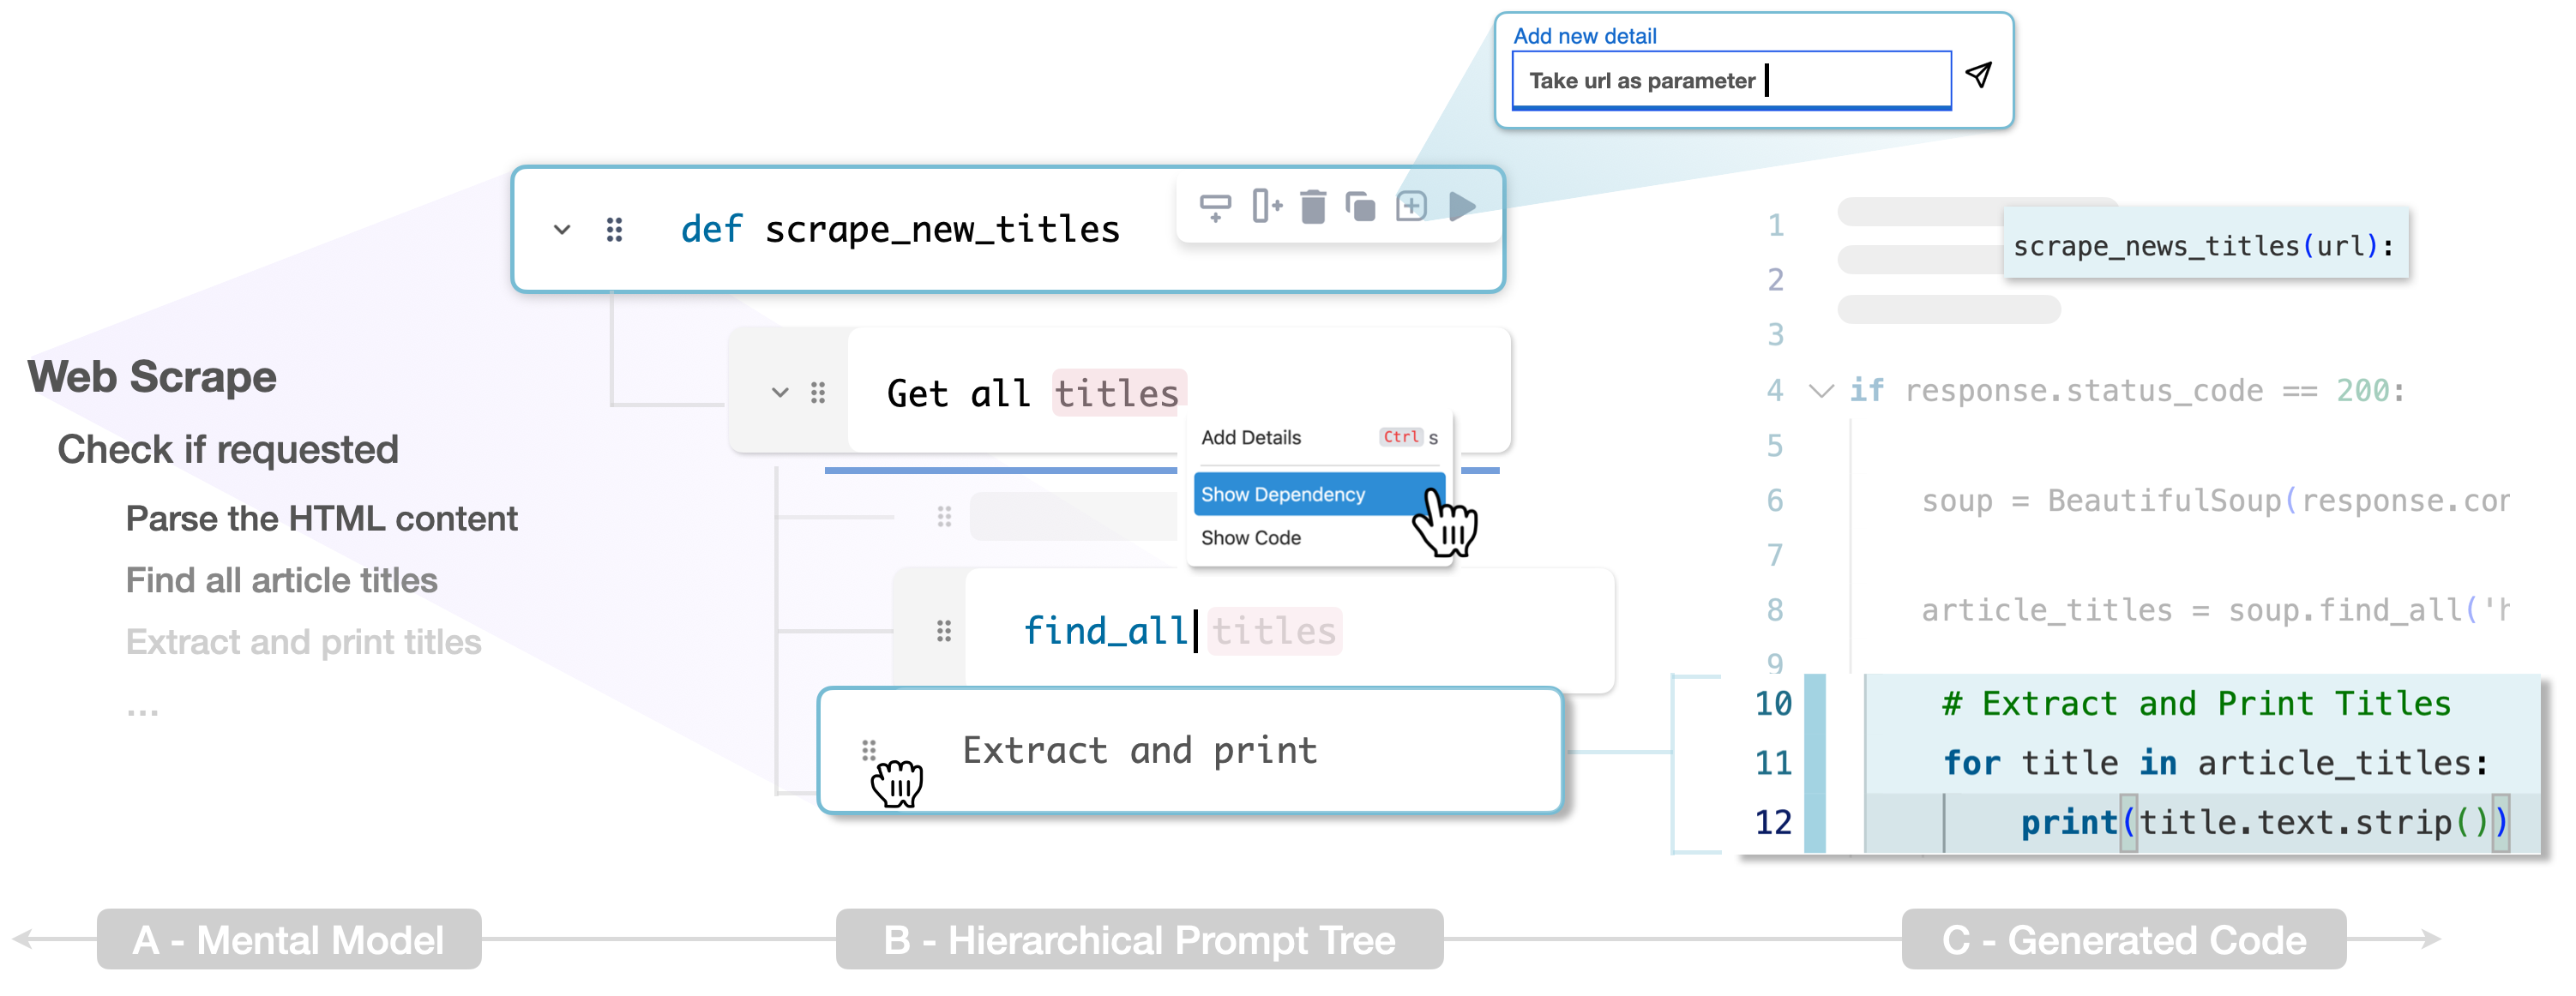
Ryan Yen, Jiawen Stefanie Zhu, Sangho Suh, Haijun Xia, Jian Zhao.
CoLadder: Supporting Programmers with Hierarchical Code Generation in Multi-Level Abstraction. Proceedings of ACM Symposium on User Interface Software and Technology, pp. 11:1-11:20, 2024.
[C35]
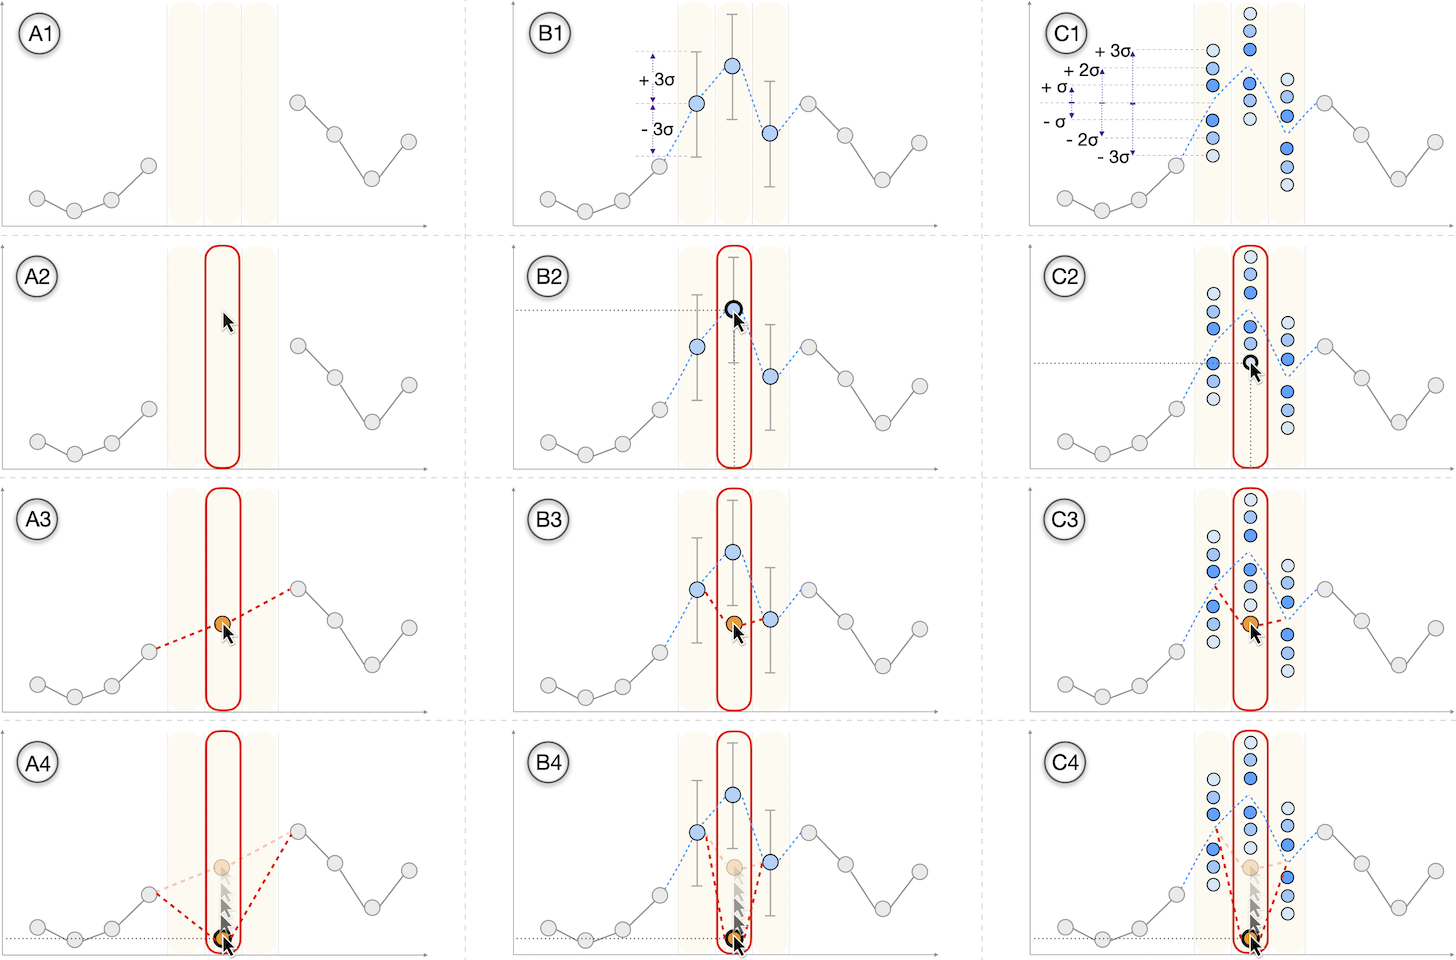
Maoyuan Sun, Yuanxin Wang, Courtney Bolton, Yue Ma, Tianyi Li, Jian Zhao.
Investigating User Estimation of Missing Data in Visual Analysis. Proceedings of the Graphics Interface Conference, pp. 30:1-30:13, 2024.
[C34]
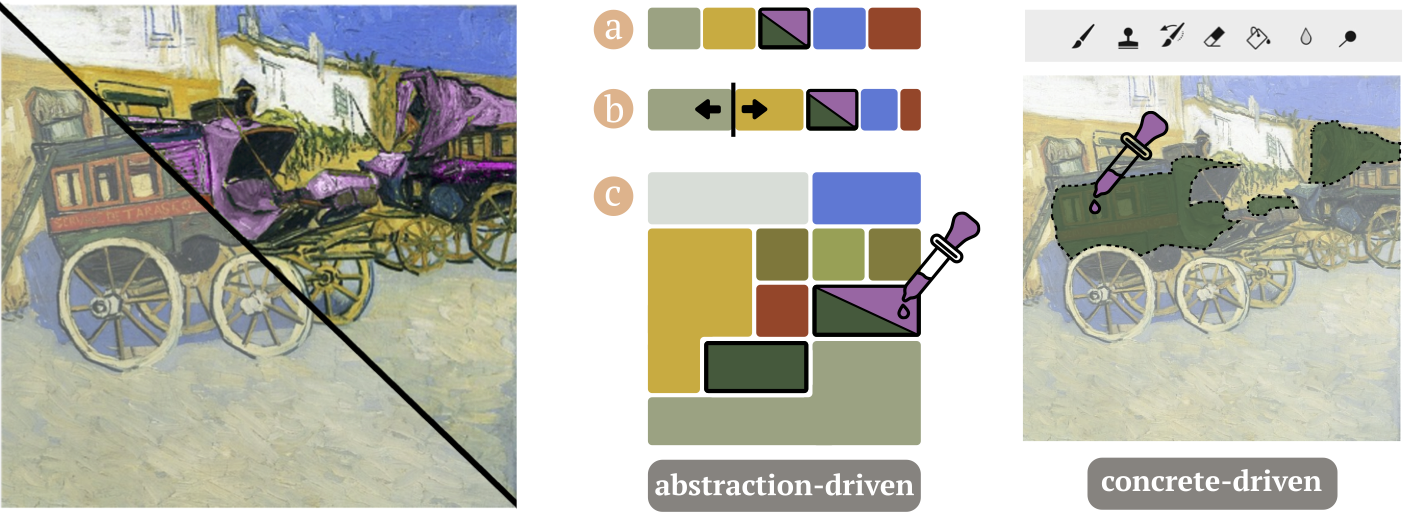
Xinyu Shi, Mingyu Liu, Ziqi Zhou, Ali Neshati, Ryan Rossi, Jian Zhao.
Exploring Interactive Color Palettes for Abstraction-Driven Exploratory Image Colorization. Proceedings of the ACM SIGCHI Conference on Human Factors in Computing Systems, pp. 146:1-146:16, 2024.
[C33]
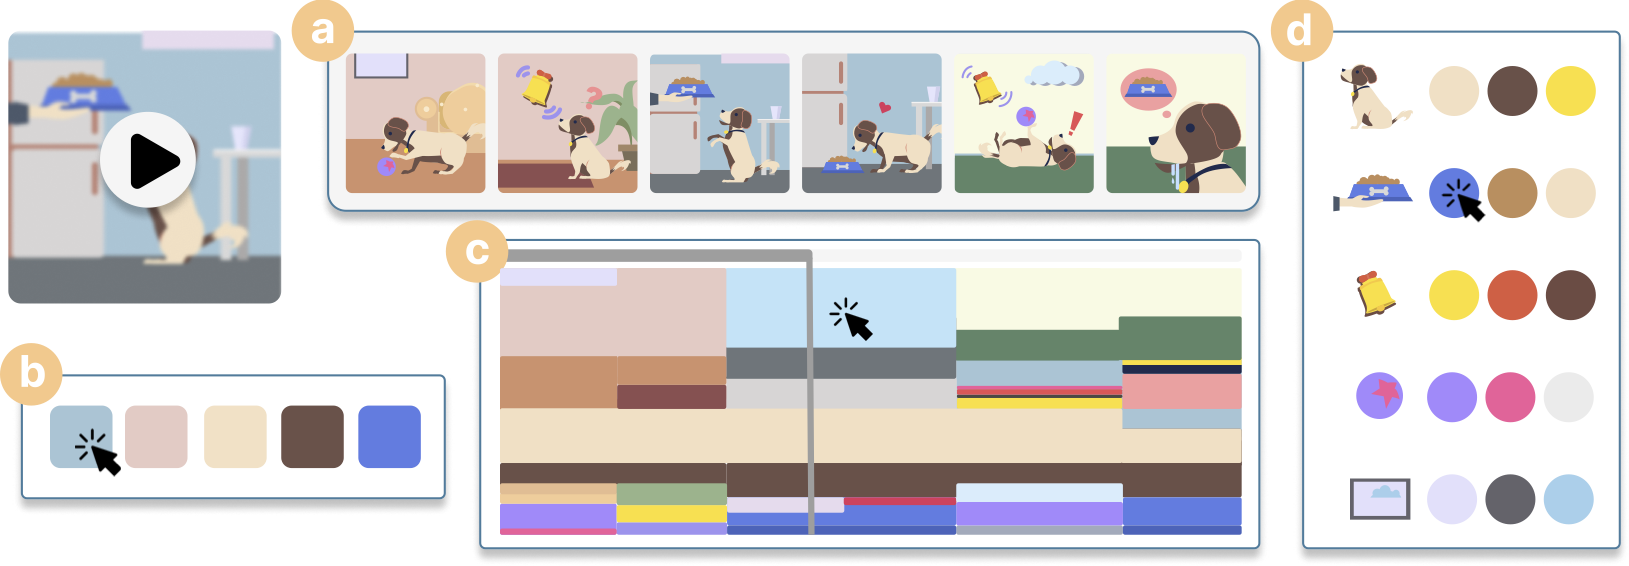
Xinyu Shi, Yinghou Wang, Yun Wang, Jian Zhao.
Piet: Facilitating Color Authoring for Motion Graphics Video. Proceedings of the ACM SIGCHI Conference on Human Factors in Computing Systems, pp. 148:1-148:17,2024.
[C32]
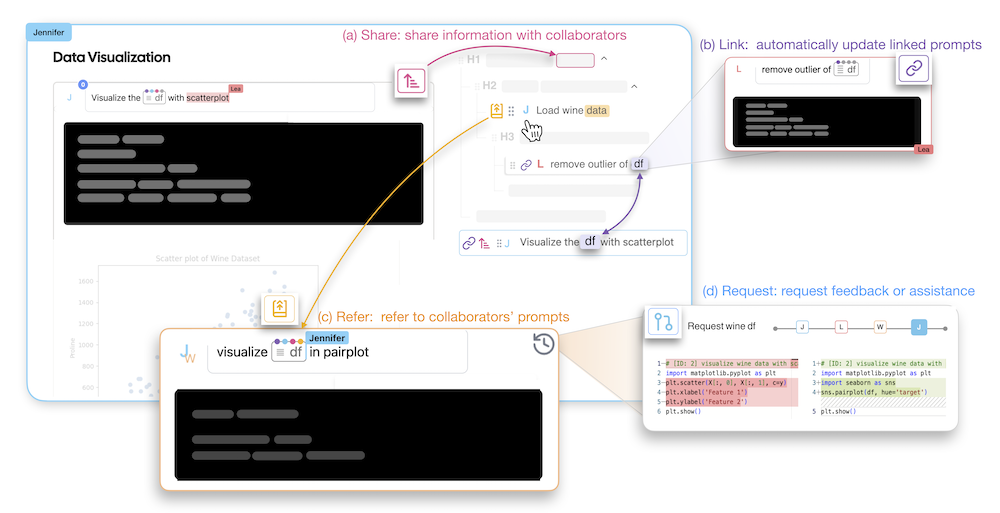
Li Feng†, Ryan Yen†, Yuzhe You, Mingming Fan, Jian Zhao, Zhicong Lu.
CoPrompt: Supporting Prompt Sharing and Referring in Collaborative Natural Language Programming. Proceedings of the ACM SIGCHI Conference on Human Factors in Computing Systems, pp. 934:1-934:21, 2024.
[C31]
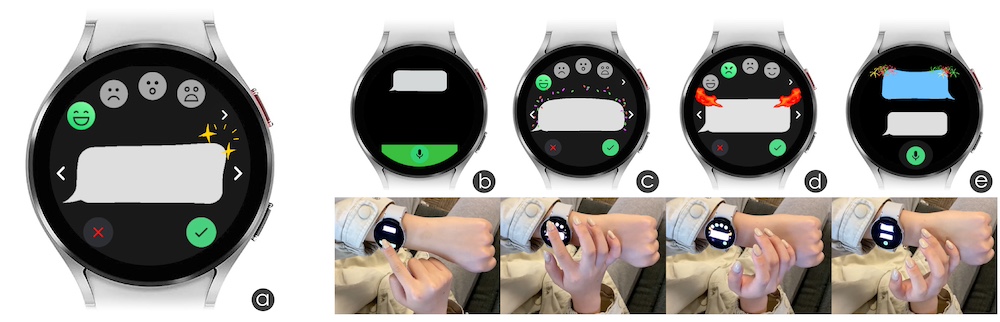
Pengcheng An, Jiawen Stefanie Zhu, Zibo Zhang, Yifei Yin, Qingyuan Ma, Che Yan, Linghao Du, Jian Zhao.
EmoWear: Exploring Emotional Teasers for Voice Message Interaction on Smartwatches. Proceedings of the ACM SIGCHI Conference on Human Factors in Computing Systems, pp. 279:1-279:16, 2024.
[C30]
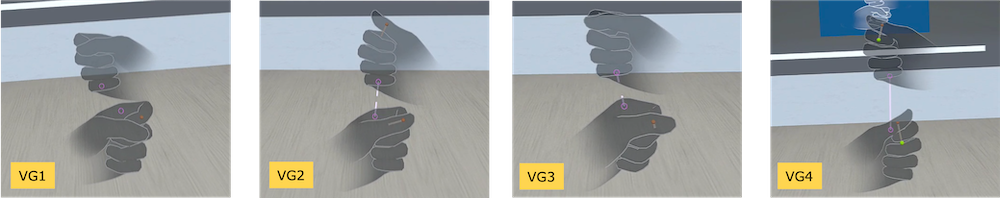
Xizi Wang, Ben Lafreniere, Jian Zhao.
Exploring Visualizations for Precisely Guiding Bare Hand Gestures in Virtual Reality. Proceedings of the ACM SIGCHI Conference on Human Factors in Computing Systems, pp. 636:1-636:19, 2024.
[W18]
Ryan Yen, Jian Zhao, Daniel Vogel.
Code Shaping: Iterative Code Editing with Free-form Sketching. Adjunct Proceedings of the ACM Symposium on User Interface Software and Technology (Poster), pp. 101:1-101:3, 2024.
[W17]
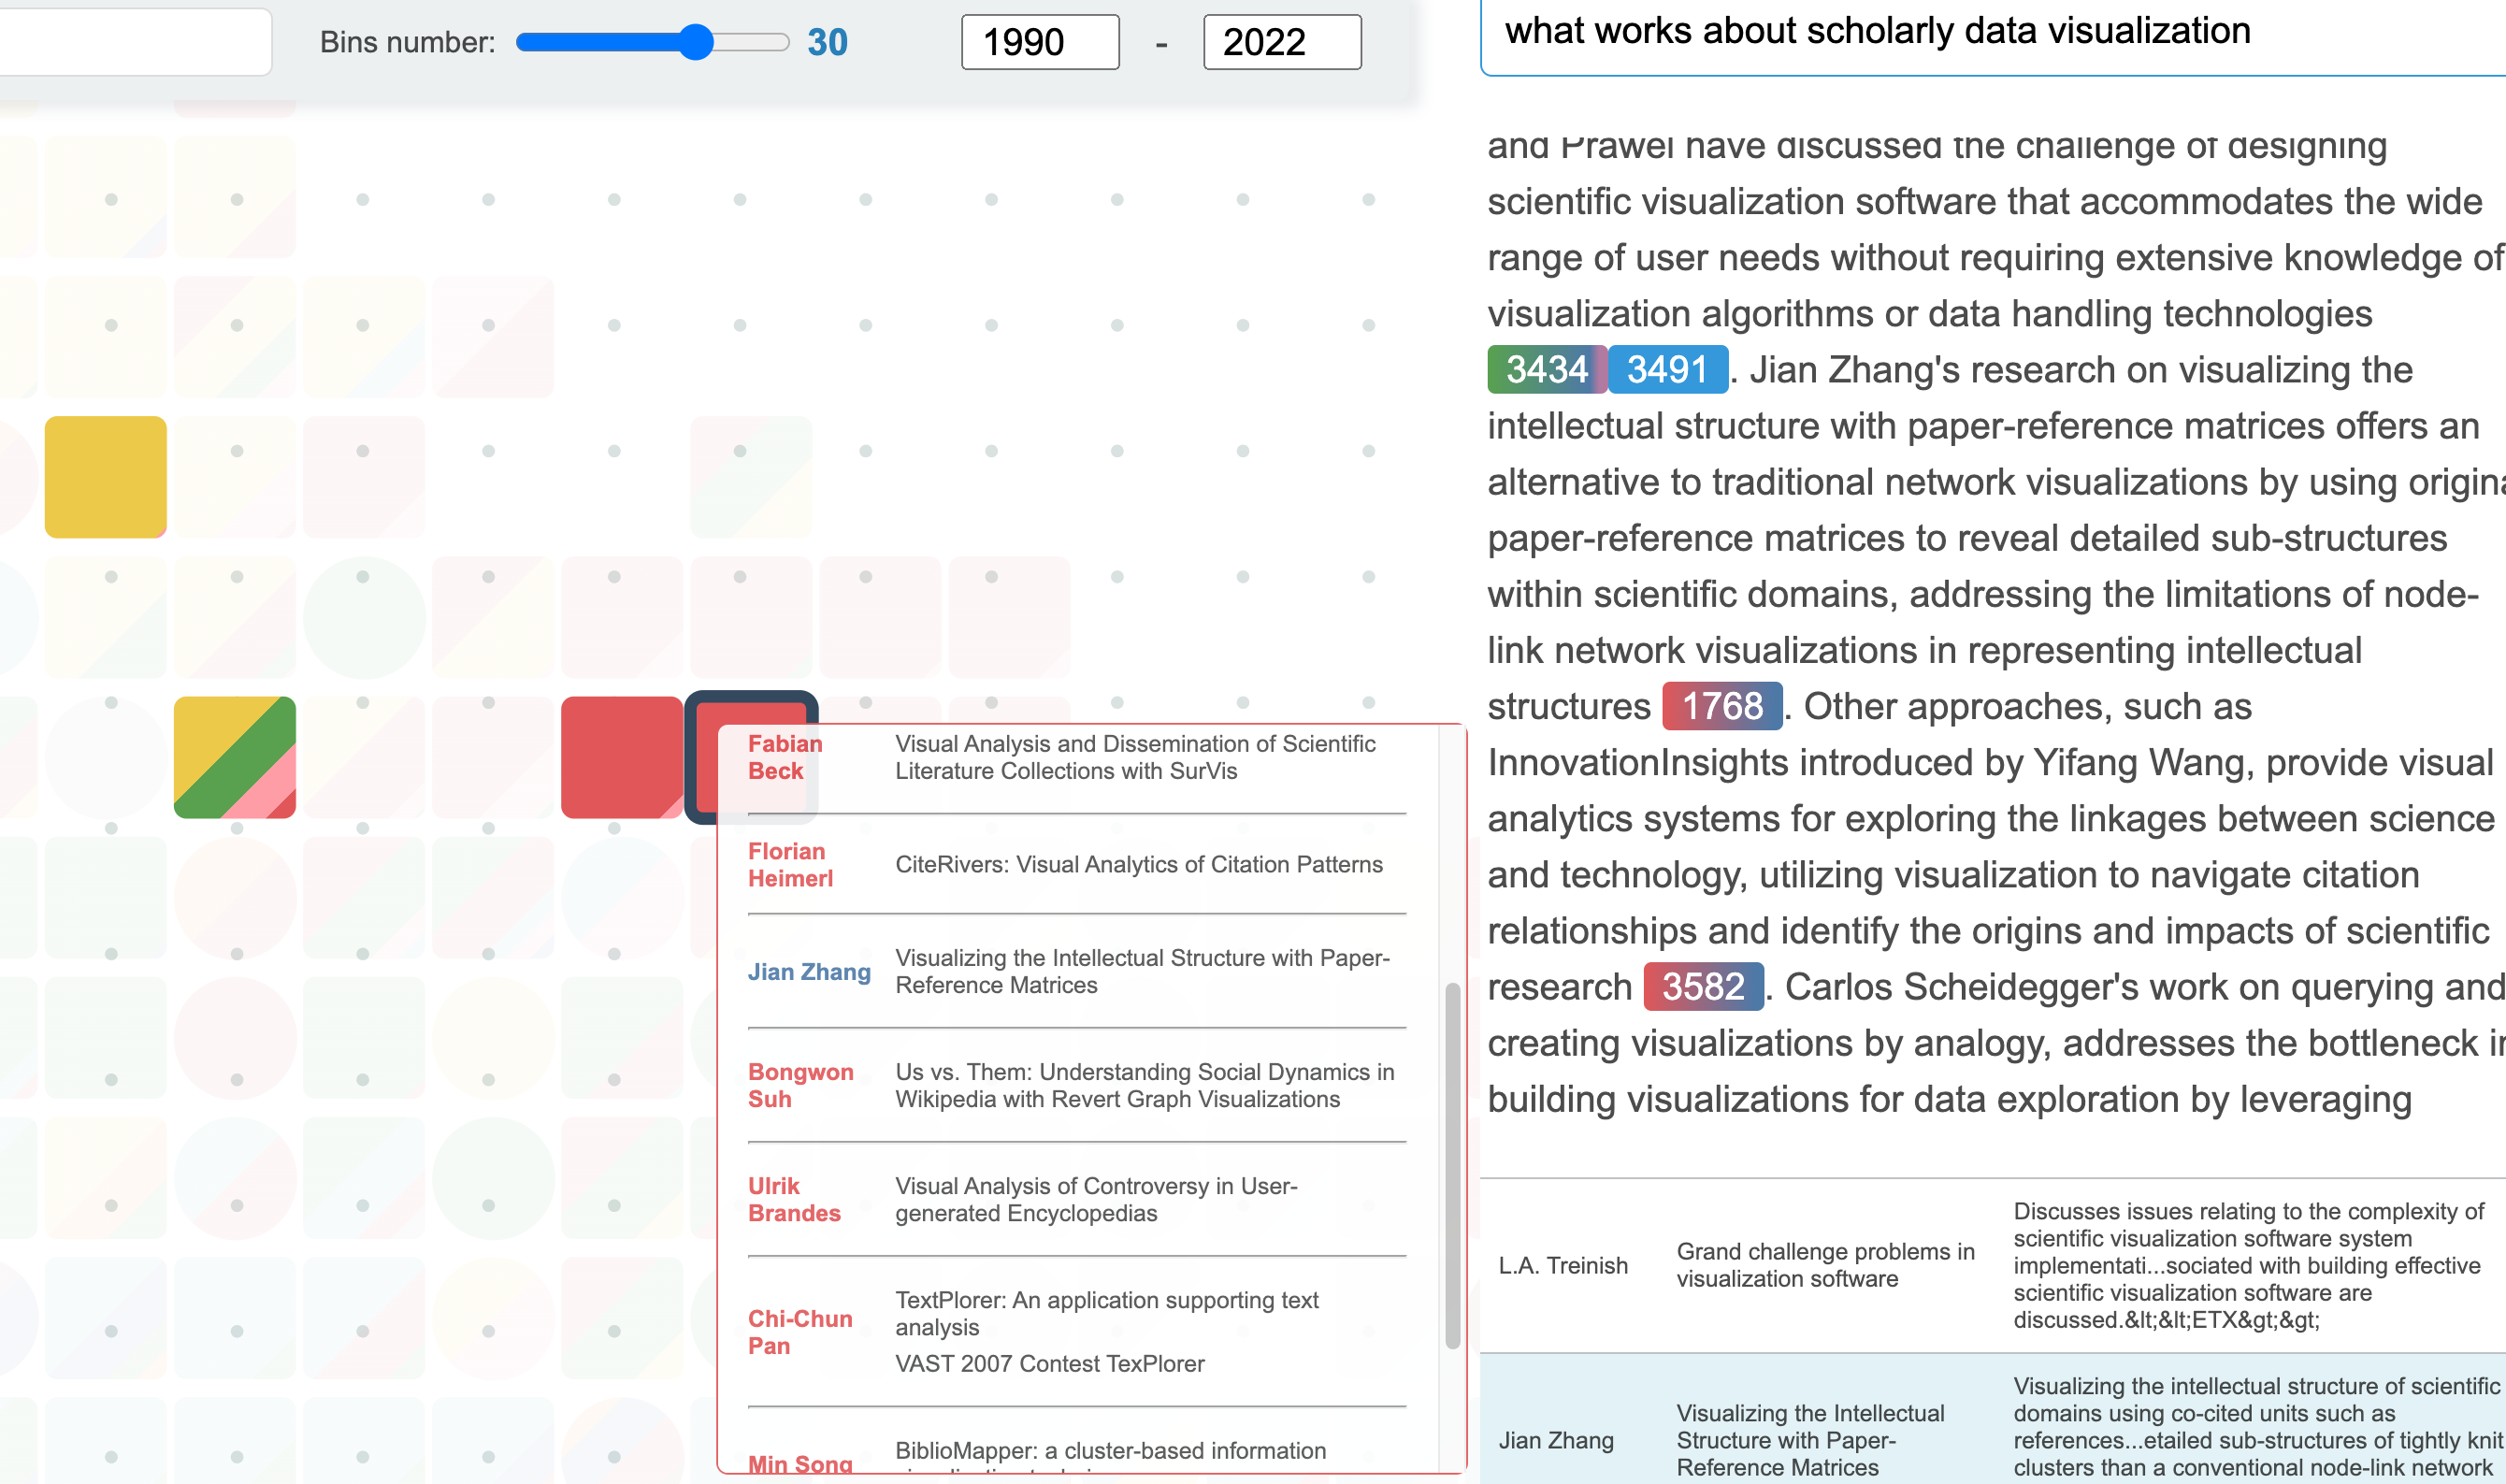
Ryan Yen, Yelizaveta Brus, Leyi Yan, Jimmy Lin, Jian Zhao.
Scholarly Exploration via Conversations with Scholars-Papers Embedding. Proceedings of the IEEE Conference Visualization and Visual Analytics (Poster), 2024.
[W16]
Ryan Yen, Nicole Sultanum, Jian Zhao.
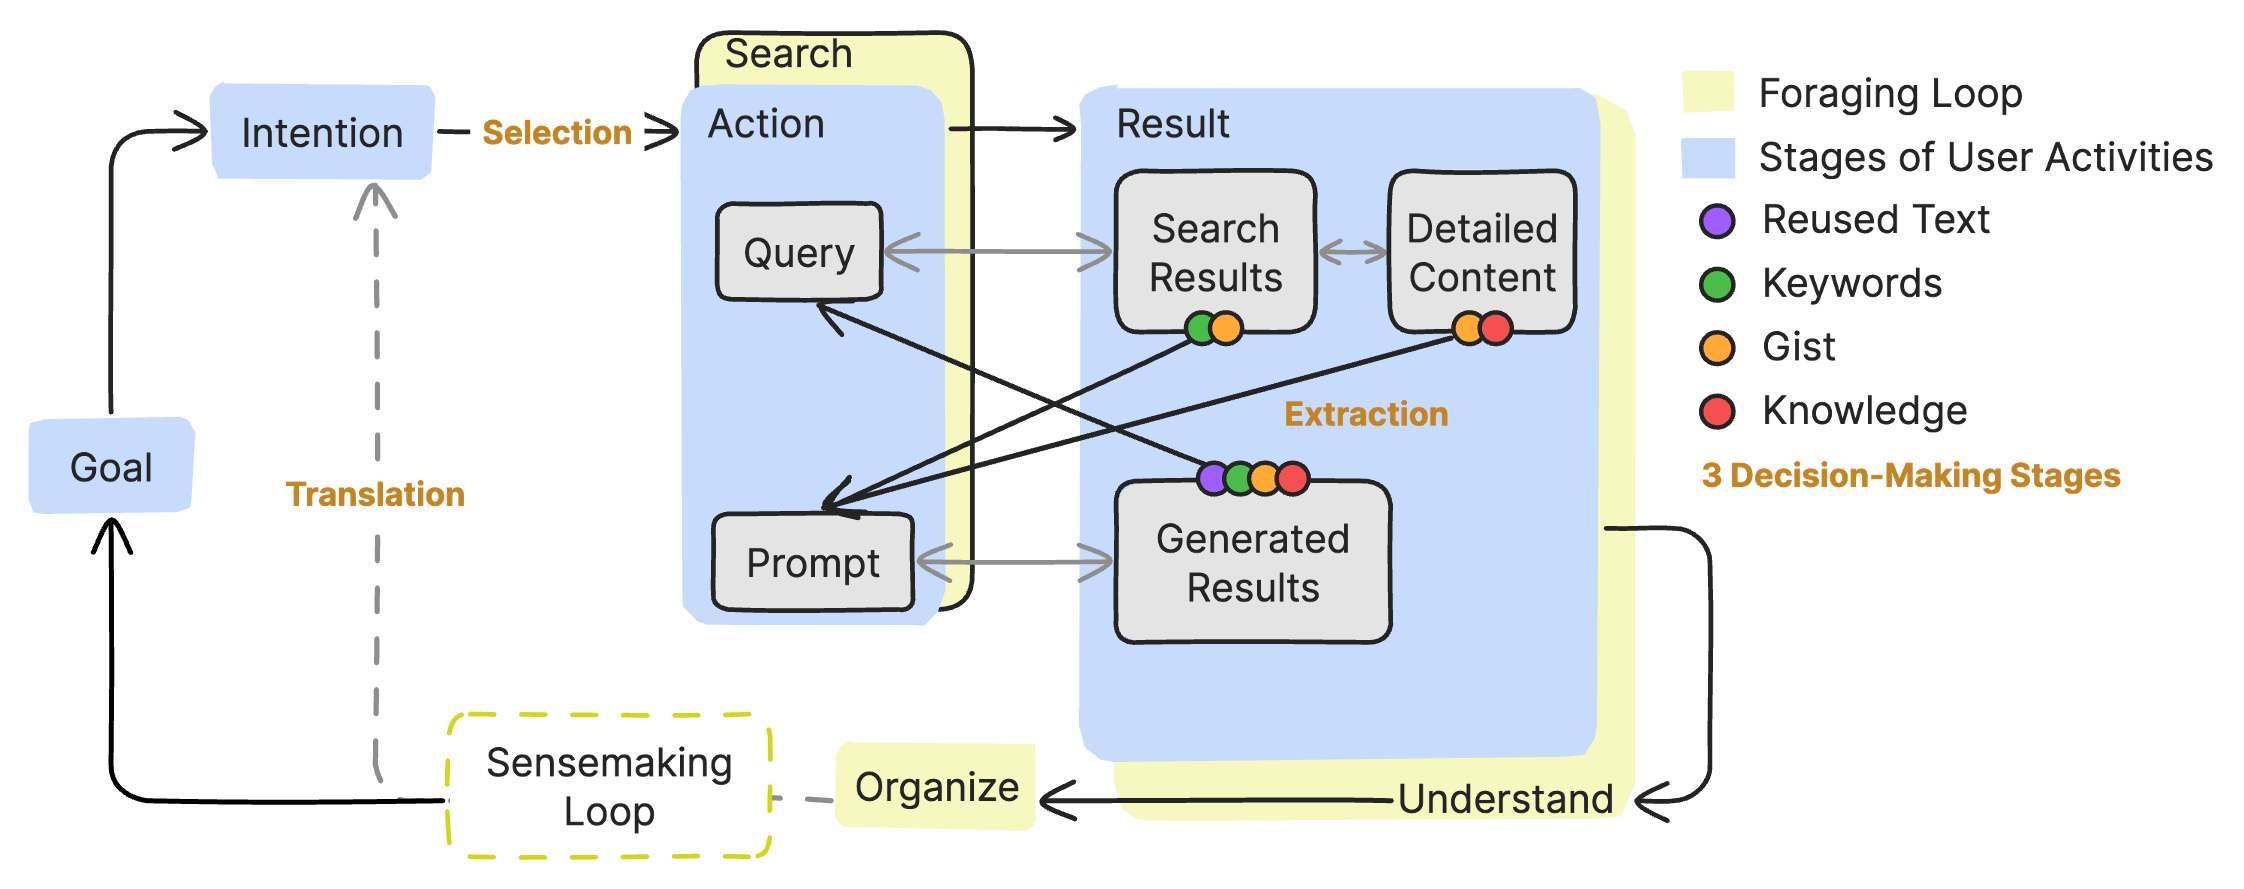
To Search or To Gen? Exploring the Synergy between Generative AI and Web Search in Programming. Extended Abstracts of the CHI Conference on Human Factors in Computing Systems, pp. 327:1-327:8, 2024.
[W15]
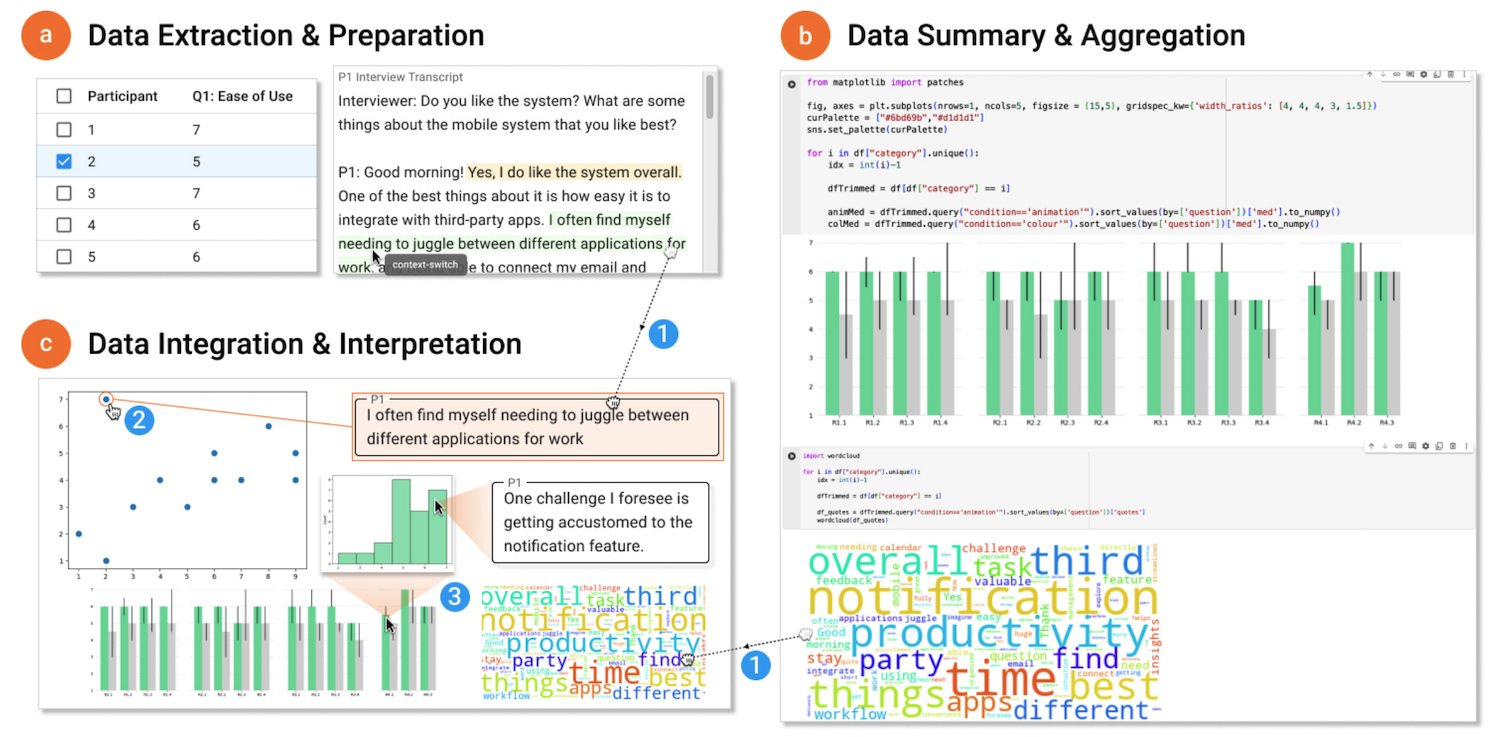
Jiawen Stefanie Zhu†, Zibo Zhang†, Jian Zhao.
Facilitating Mixed-Methods Analysis with Computational Notebooks. Proceedings of the First Workshop on Human-Notebook Interactions, 2024.
[W14]
Yue Lyu, Pengcheng An, Huan Zhang, Keiko Katsuragawa, Jian Zhao.
Designing AI-Enabled Games to Support Social-Emotional Learning for Children with Autism Spectrum Disorders. Proceedings of the Second Workshop on Child-Centred AI, 2024.
[W13]
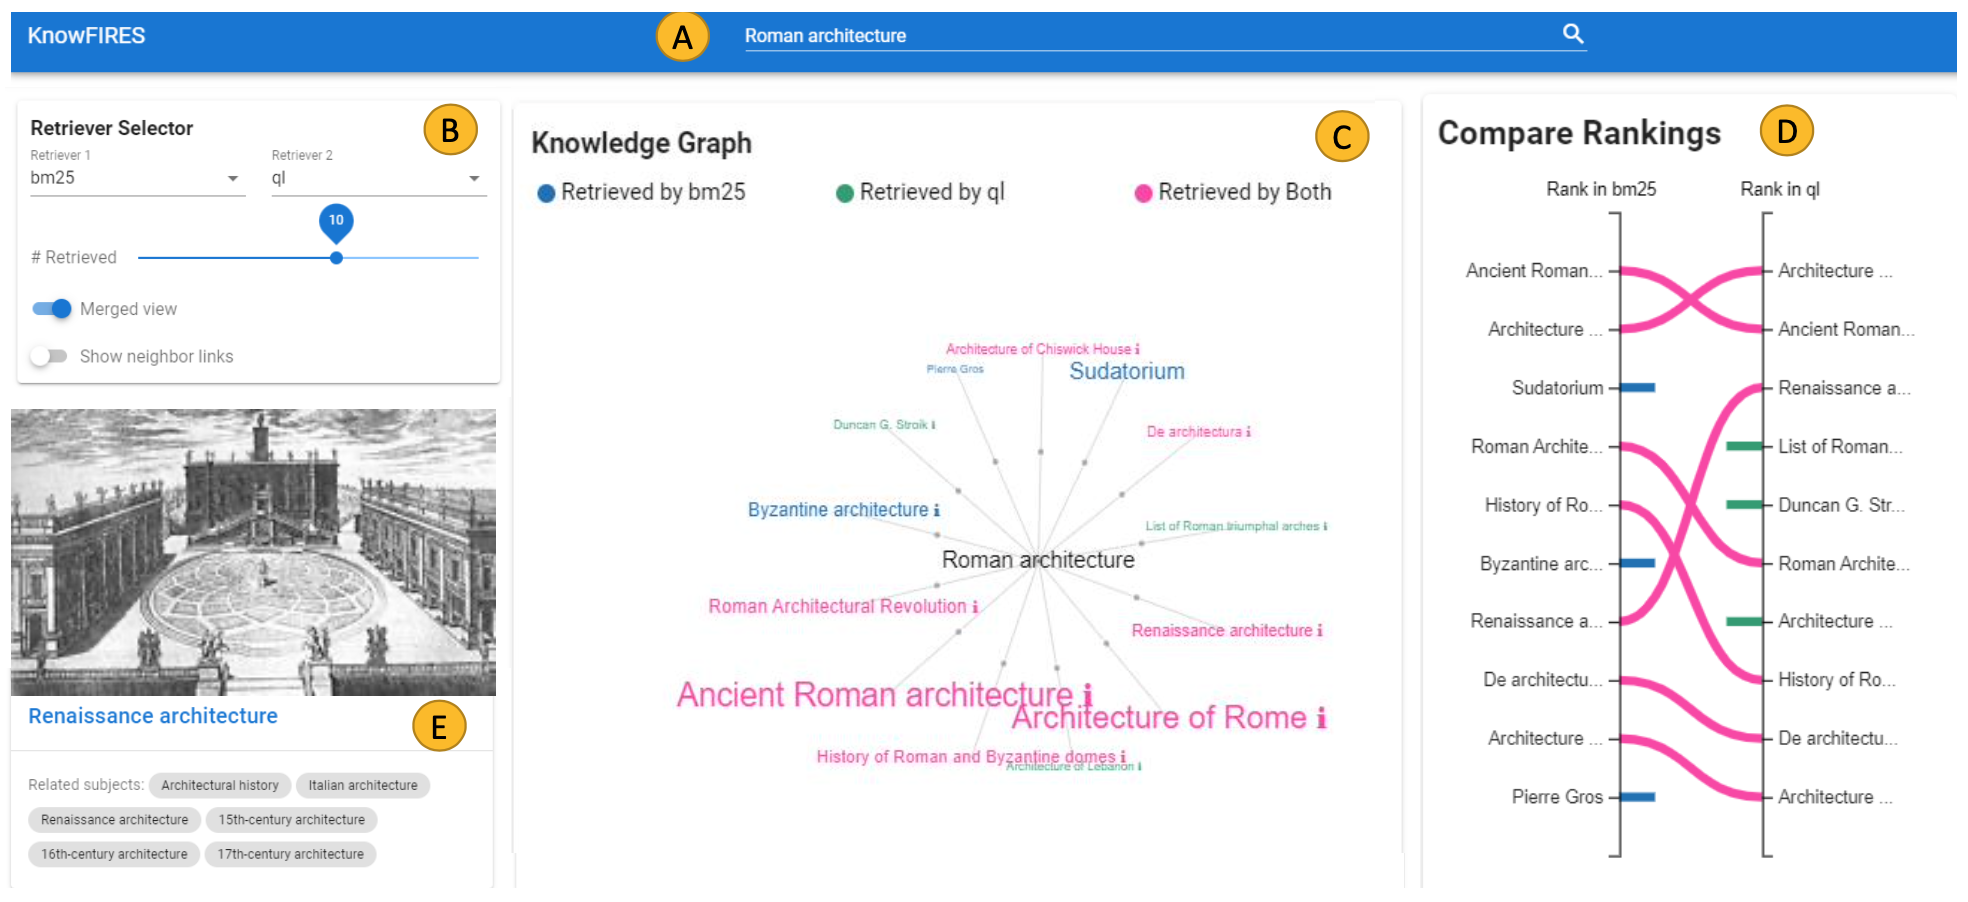
Negar Arabzadeh, Kiarash Golzadeh, Christopher Risi, Charles Clarke, Jian Zhao.
KnowFIRES: a Knowledge-graph Framework for Interpreting Retrieved Entities from Search. Advances in Information Retrieval (Proceedings of ECIR'24 (Demo)), pp. 182-188, 2024.
2023
[J33]
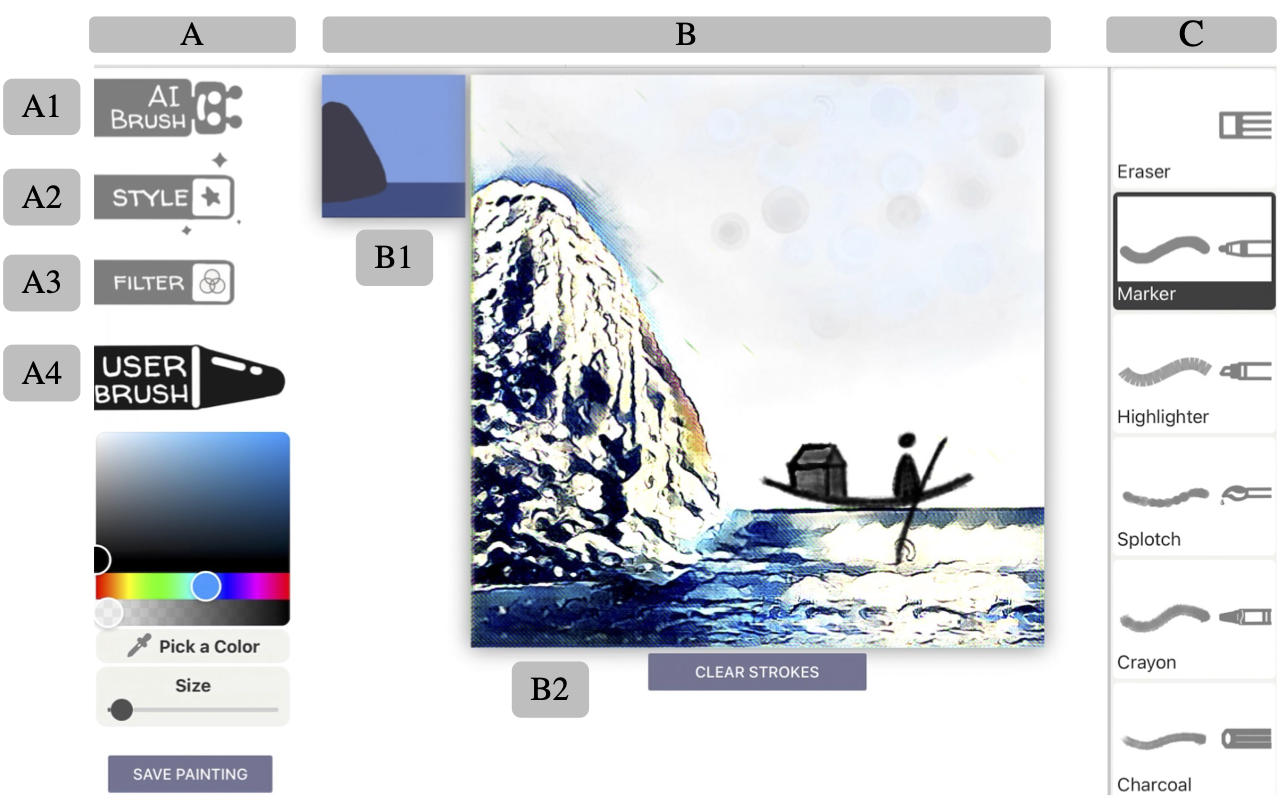
Xuejun Du†, Pengcheng An†, Justin Leung, April Li, Linda Chapman, Jian Zhao.
DeepThInk: Designing and Probing Human-AI Co-Creation in Digital Art Therapy. International Journal of Human-Computer Studies, 181, pp. 103139:1-103139:17, 2024 (Accepted in 2023).
[J32]
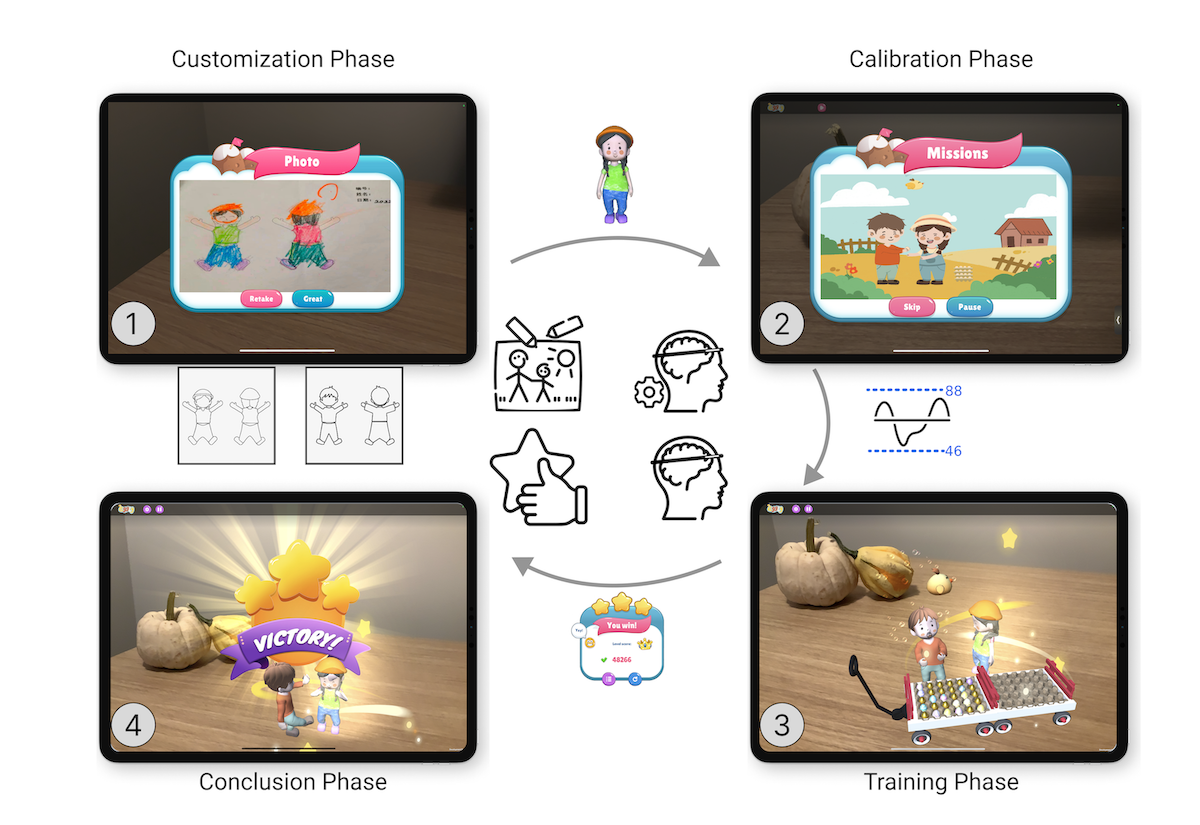
Yue Lyu, Pengcheng An, Yage Xiao, Zibo Zhang, Huan Zhang, Keiko Katsuragawa, Jian Zhao.
Eggly: Designing Mobile Augmented Reality Neurofeedback Training Games for Children with Autism Spectrum Disorder. Proceedings of the ACM on Interactive, Mobile, Wearable and Ubiquitous Technologies, 7(2), pp.67:1-67:29, 2023.
[J31]
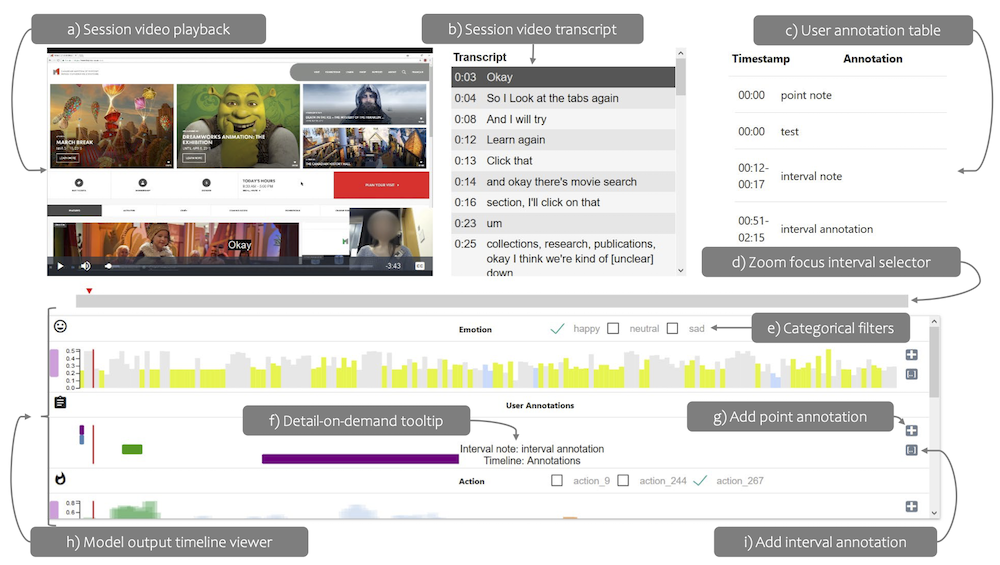
Andrea Batch, Yipeng Ji, Mingming Fan, Jian Zhao, Niklas Elmqvist.
uxSense: Supporting User Experience Analysis with Visualization and Computer Vision. IEEE Transactions on Visualization and Computer Graphics, 30(7), pp. 3841-3856, 2024 (Accepted in 2023).
[C29]
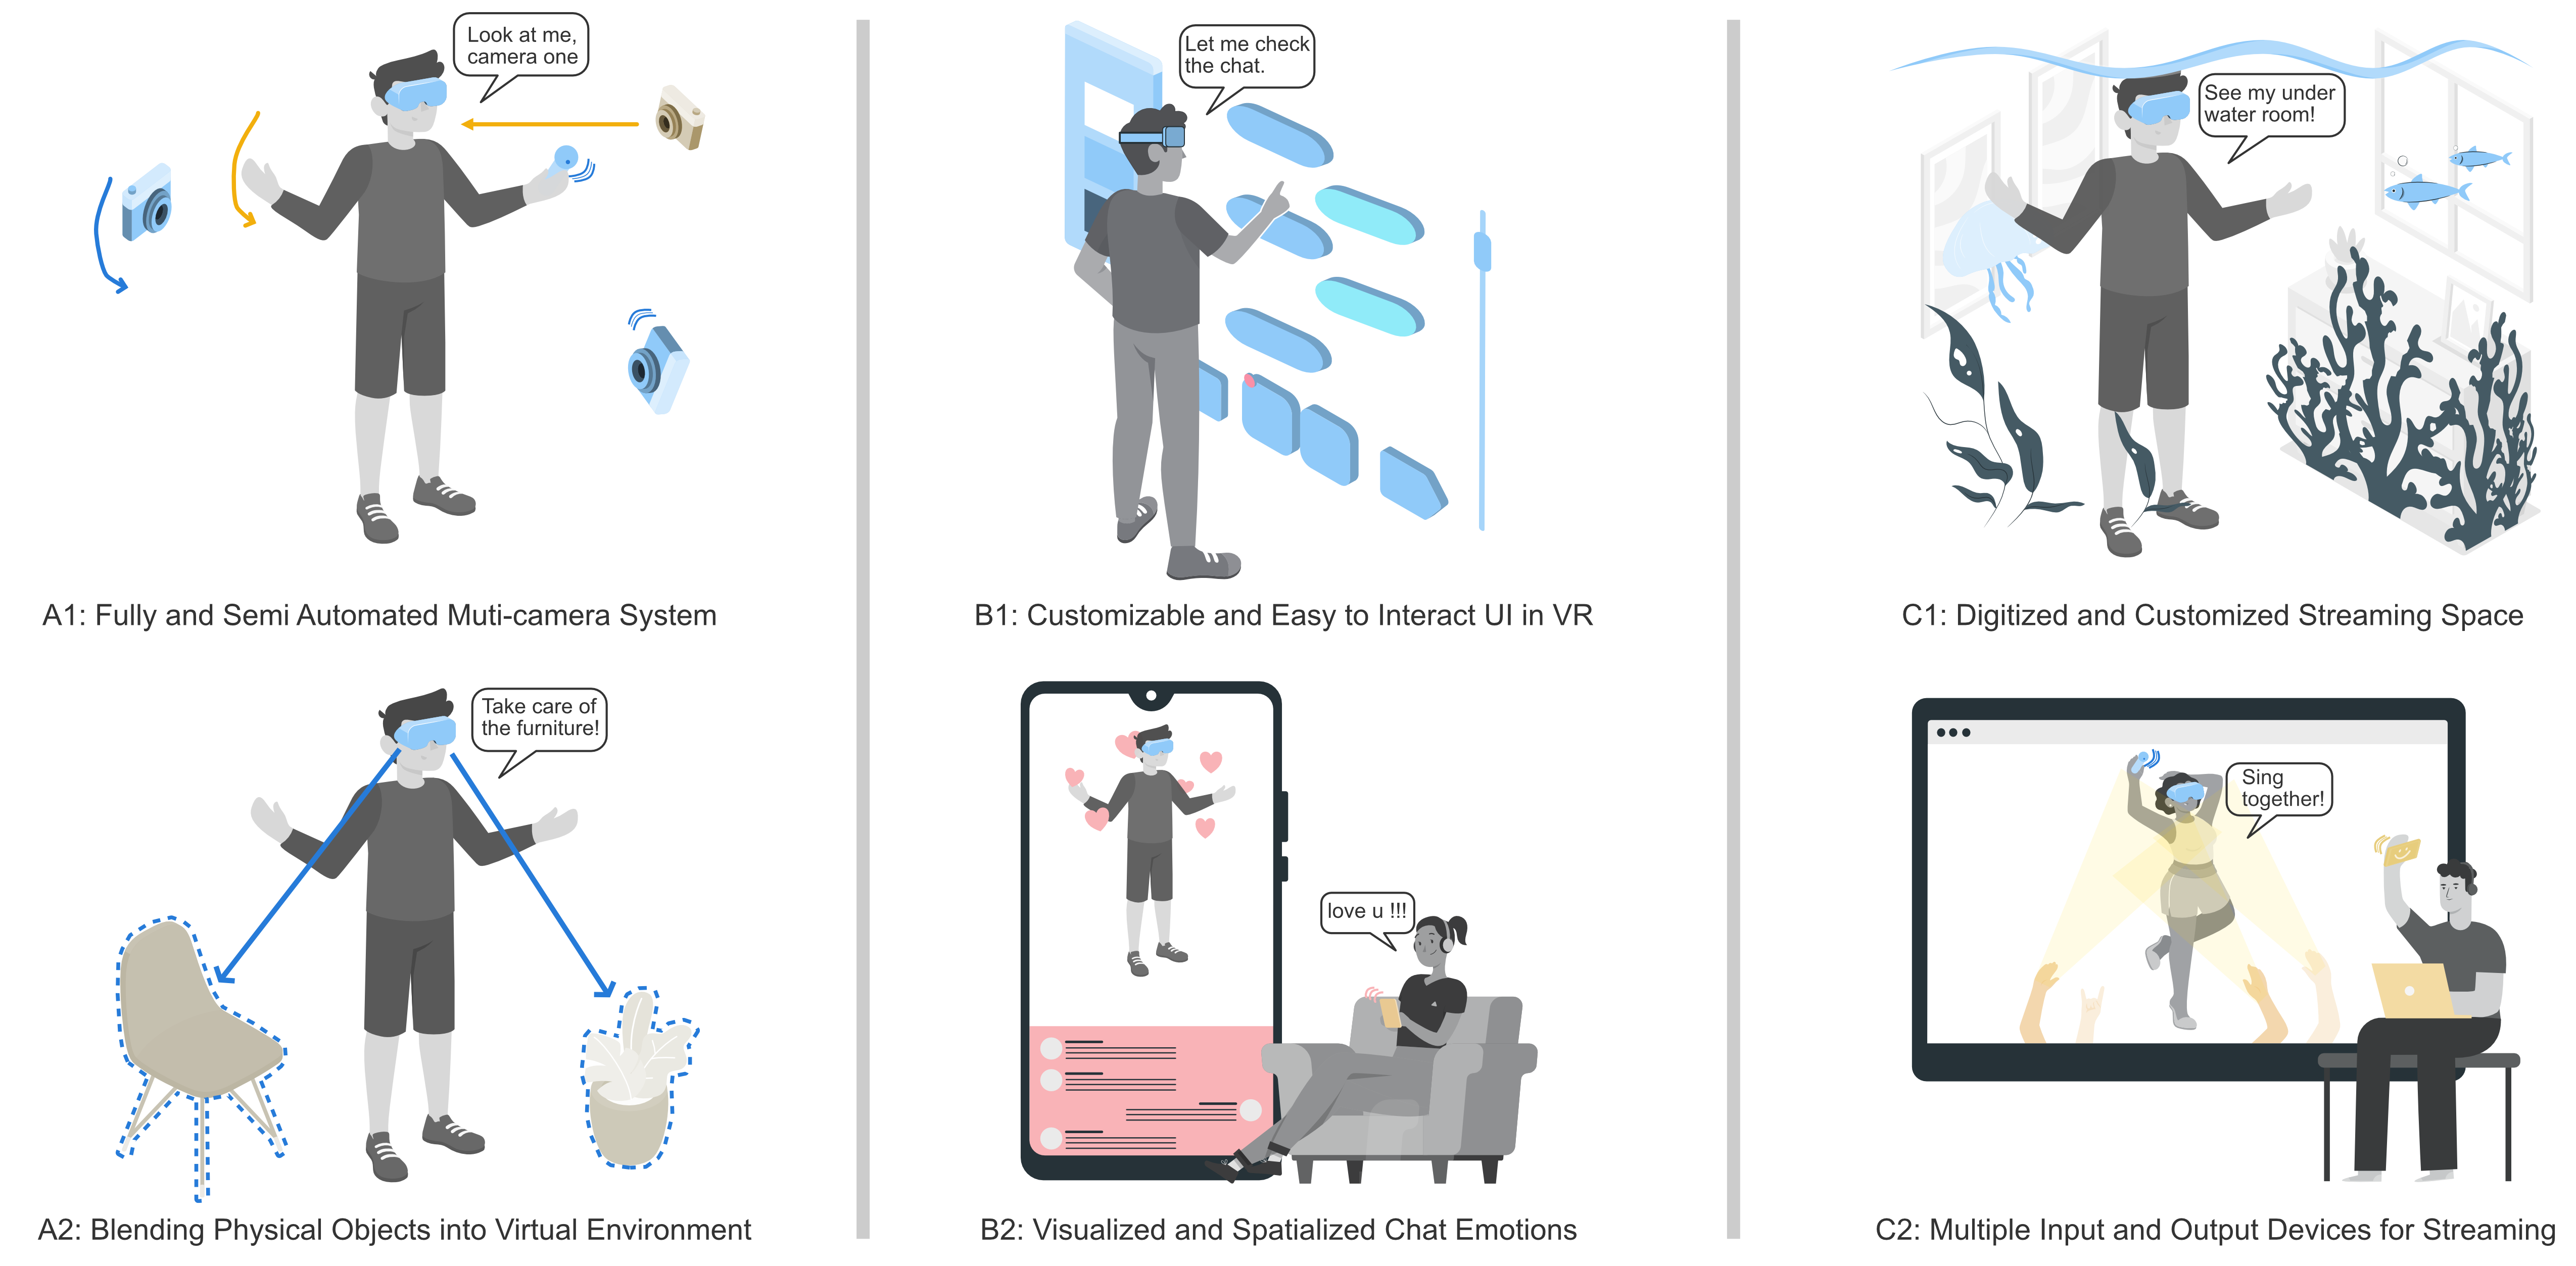
Liwei Wu, Qing Liu, Jian Zhao, Edward Lank.
Interactions across Displays and Space: A Study of Virtual Reality Streaming Practices on Twitch. Proceedings of the ACM Interactive Surfaces and Spaces Conference, pp. 437:1-437:24, 2023.
[C28]
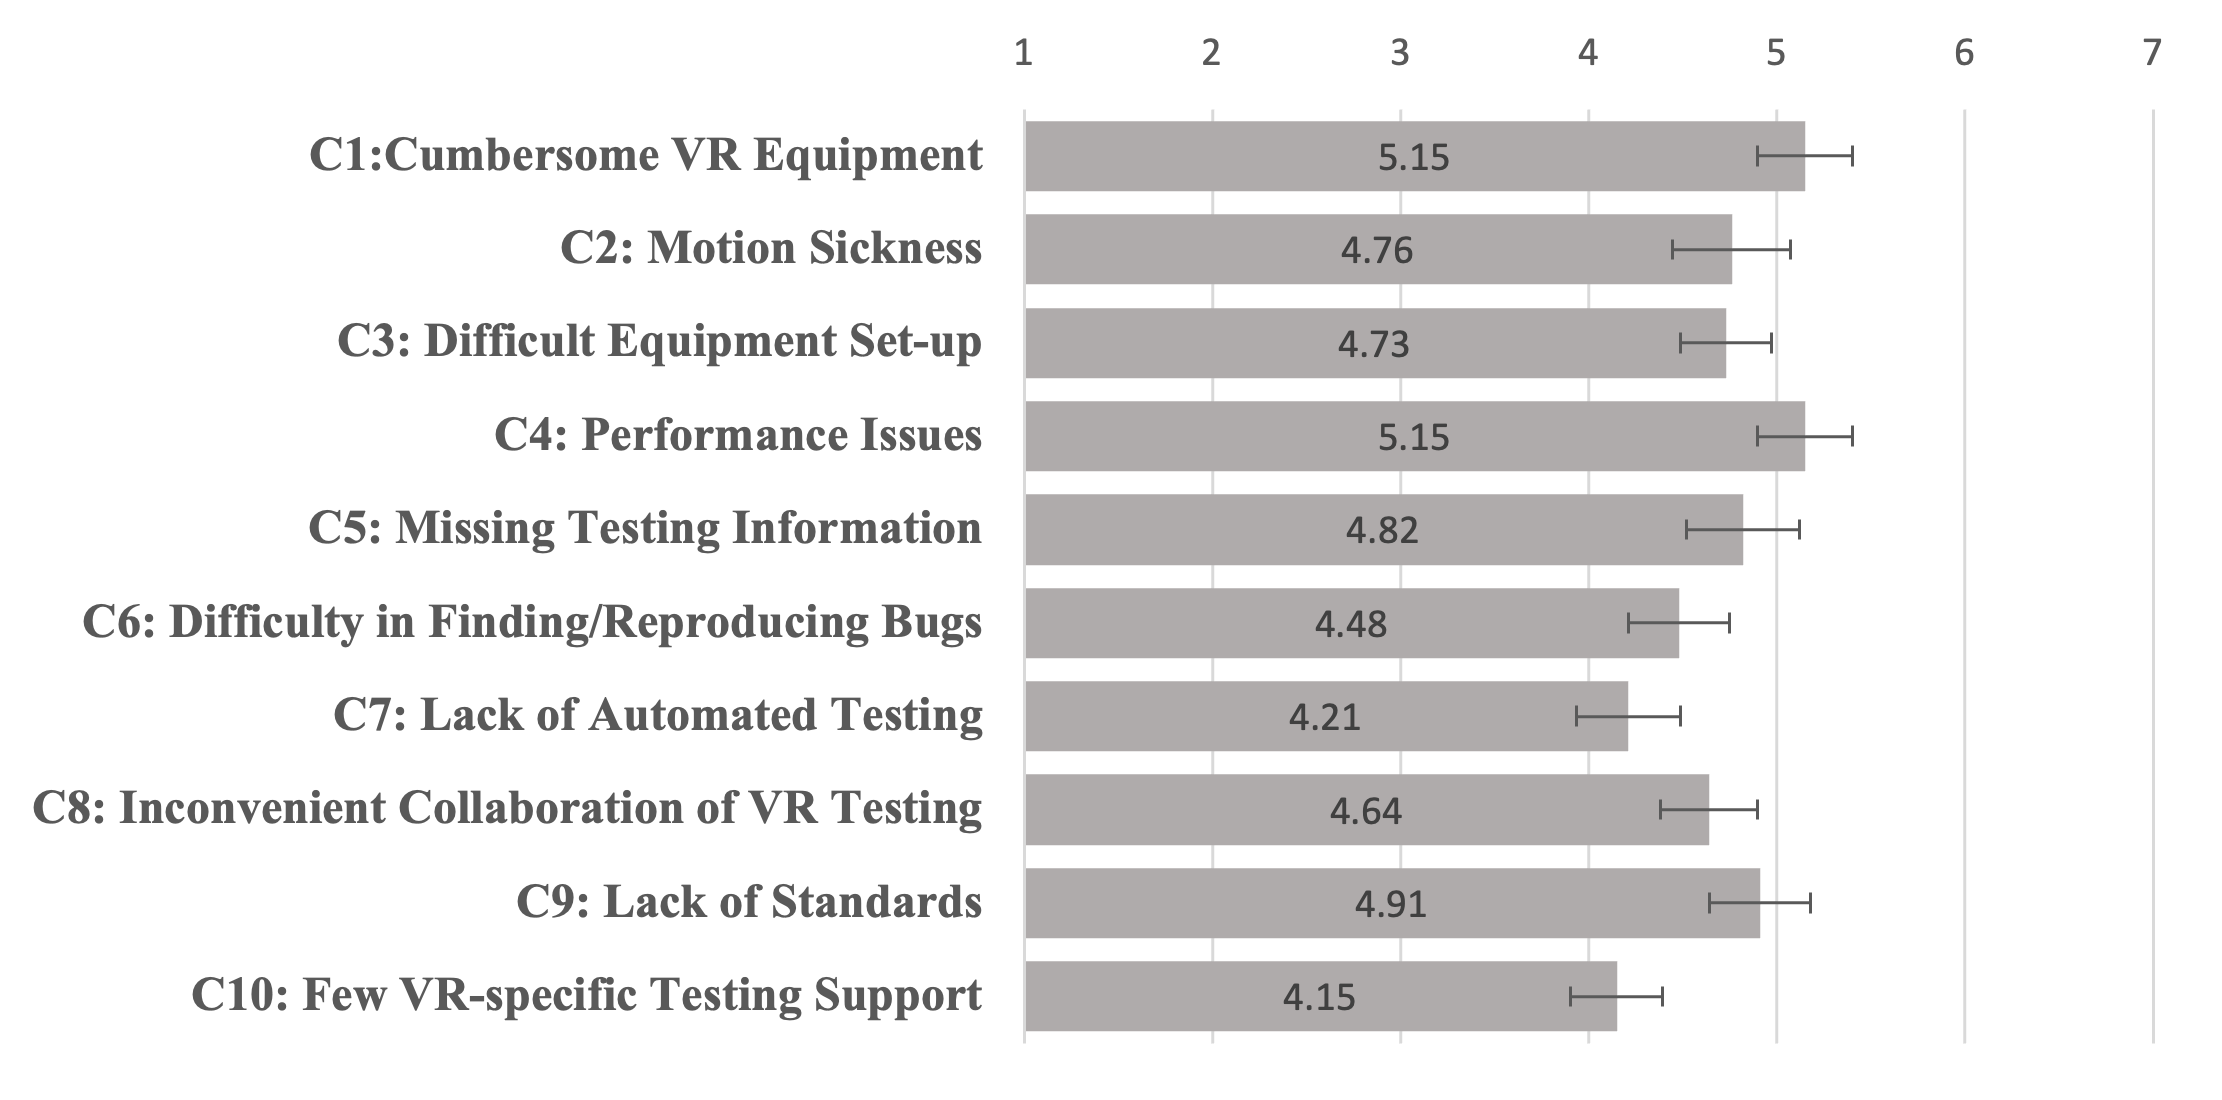
Qing Liu, Gustavo Alves, Jian Zhao.
Challenges and Opportunities for Software Testing in Virtual Reality Application Development. Proceedings of the Graphics Interface Conference, 2023 (In Press).
[C27]
Xinyu Shi, Ziqi Zhou, Jingwen Zhang, Ali Neshati, Anjul Tyagi, Ryan Rossi, Shunan Guo, Fan Du, Jian Zhao.
De-Stijl: Facilitating Graphics Design with Interactive 2D Color Palette Recommendation. Proceedings of the ACM SIGCHI Conference on Human Factors in Computing Systems, pp. 122:1-122:19, 2023.
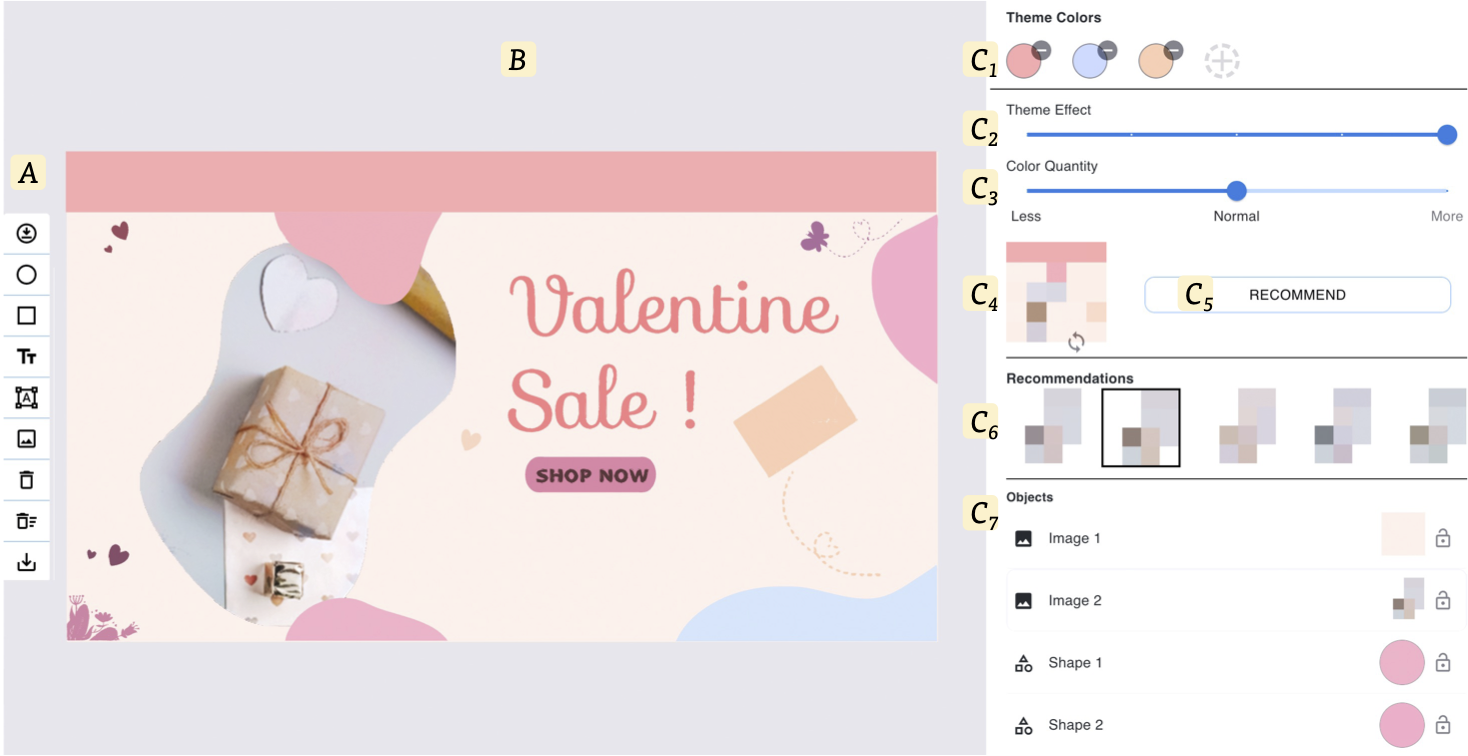
[C26]
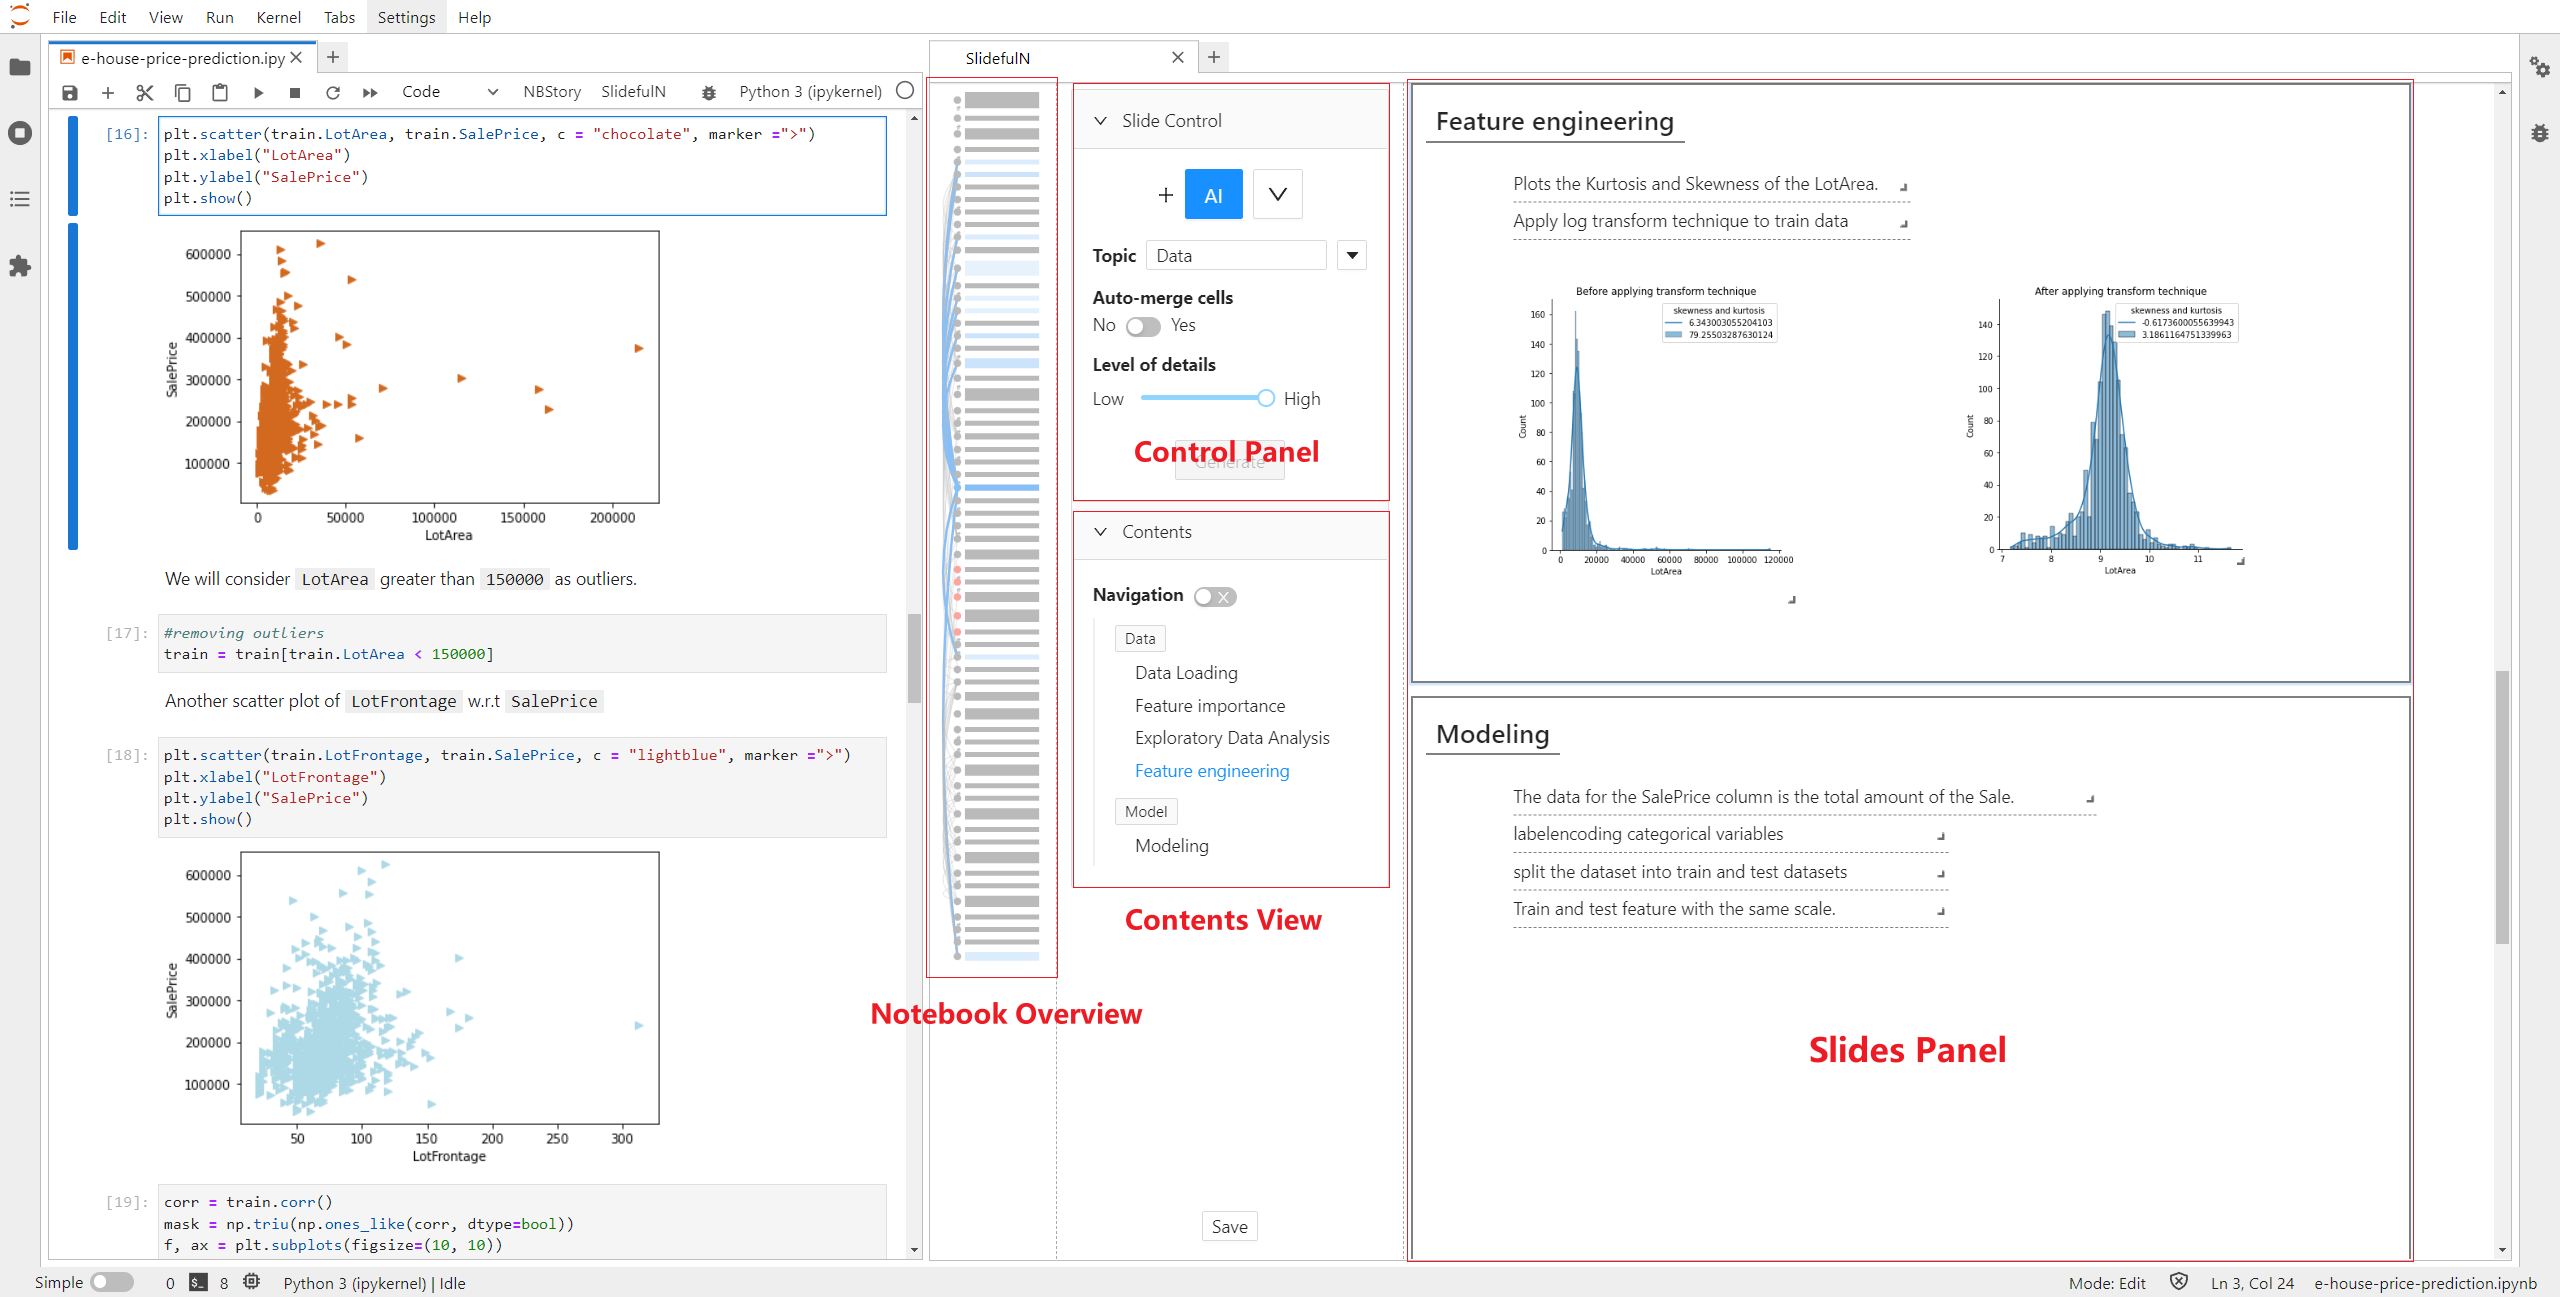
Fengjie Wang†, Xuye Liu†, Oujing Liu, Ali Neshati, Tengfei Ma, Min Zhu, Jian Zhao.
Slide4N: Creating Presentation Slides from Computational Notebooks with Human-AI Collaboration. Proceedings of the ACM SIGCHI Conference on Human Factors in Computing Systems, pp. 364:1-364:18, 2023.
[C25]
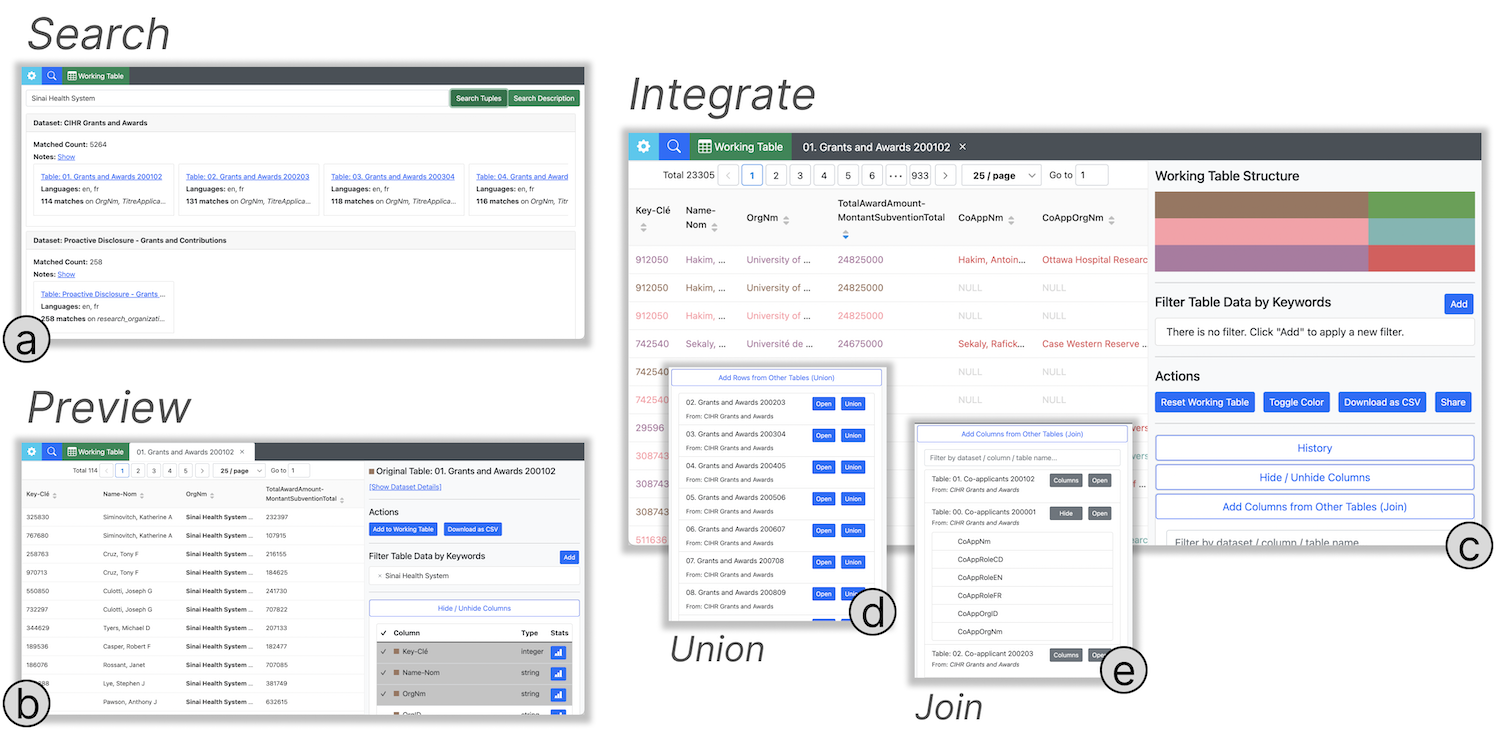
Chang Liu, Arif Usta, Jian Zhao, Semih Salihoglu.
Governor: Turning Open Government Data Portals into Interactive Databases. Proceedings of the ACM SIGCHI Conference on Human Factors in Computing Systems, pp. 415:1-415:16, 2023.
[C24]
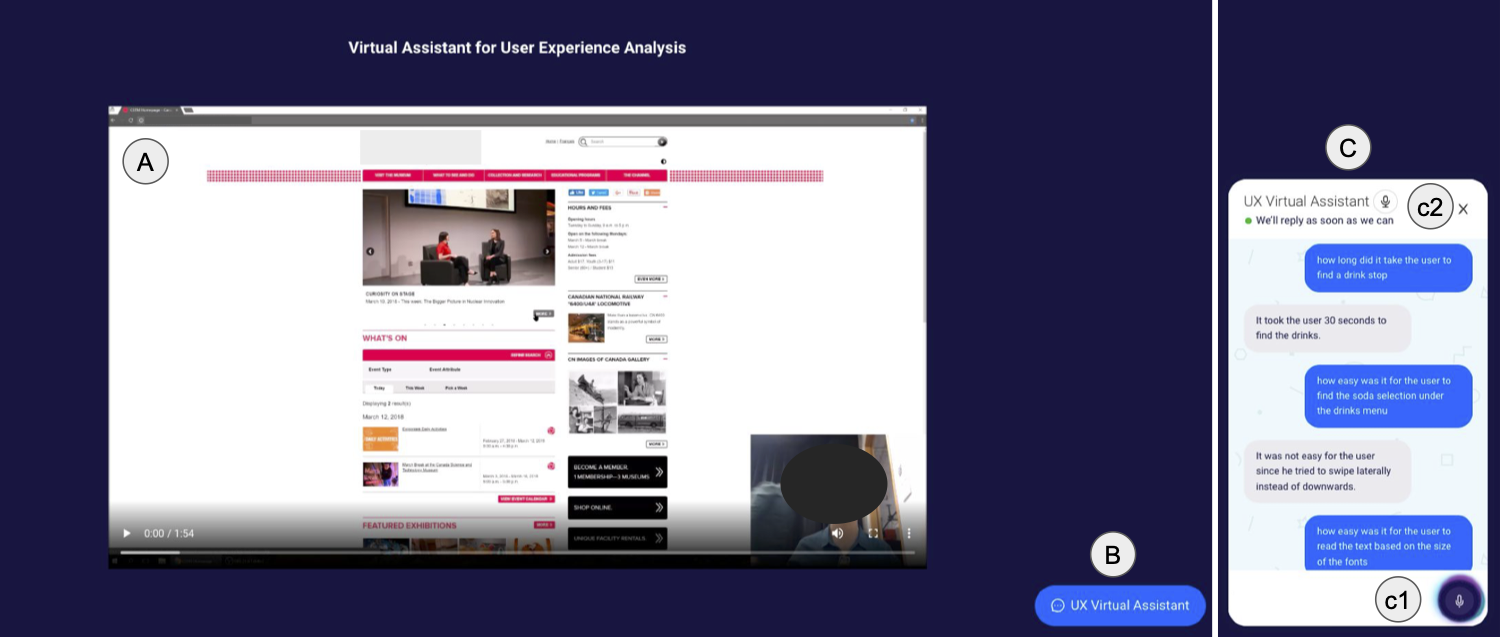
Emily Kuang, Ehsan Jahangirzadeh Soure, Mingming Fan, Jian Zhao, Kristen Shinohara.
Collaboration with Conversational AI Assistants for UX Evaluation: Questions and How to Ask them (Voice vs. Text). Proceedings of the ACM SIGCHI Conference on Human Factors in Computing Systems, pp. 116:1-116:15, 2023.
[W12]
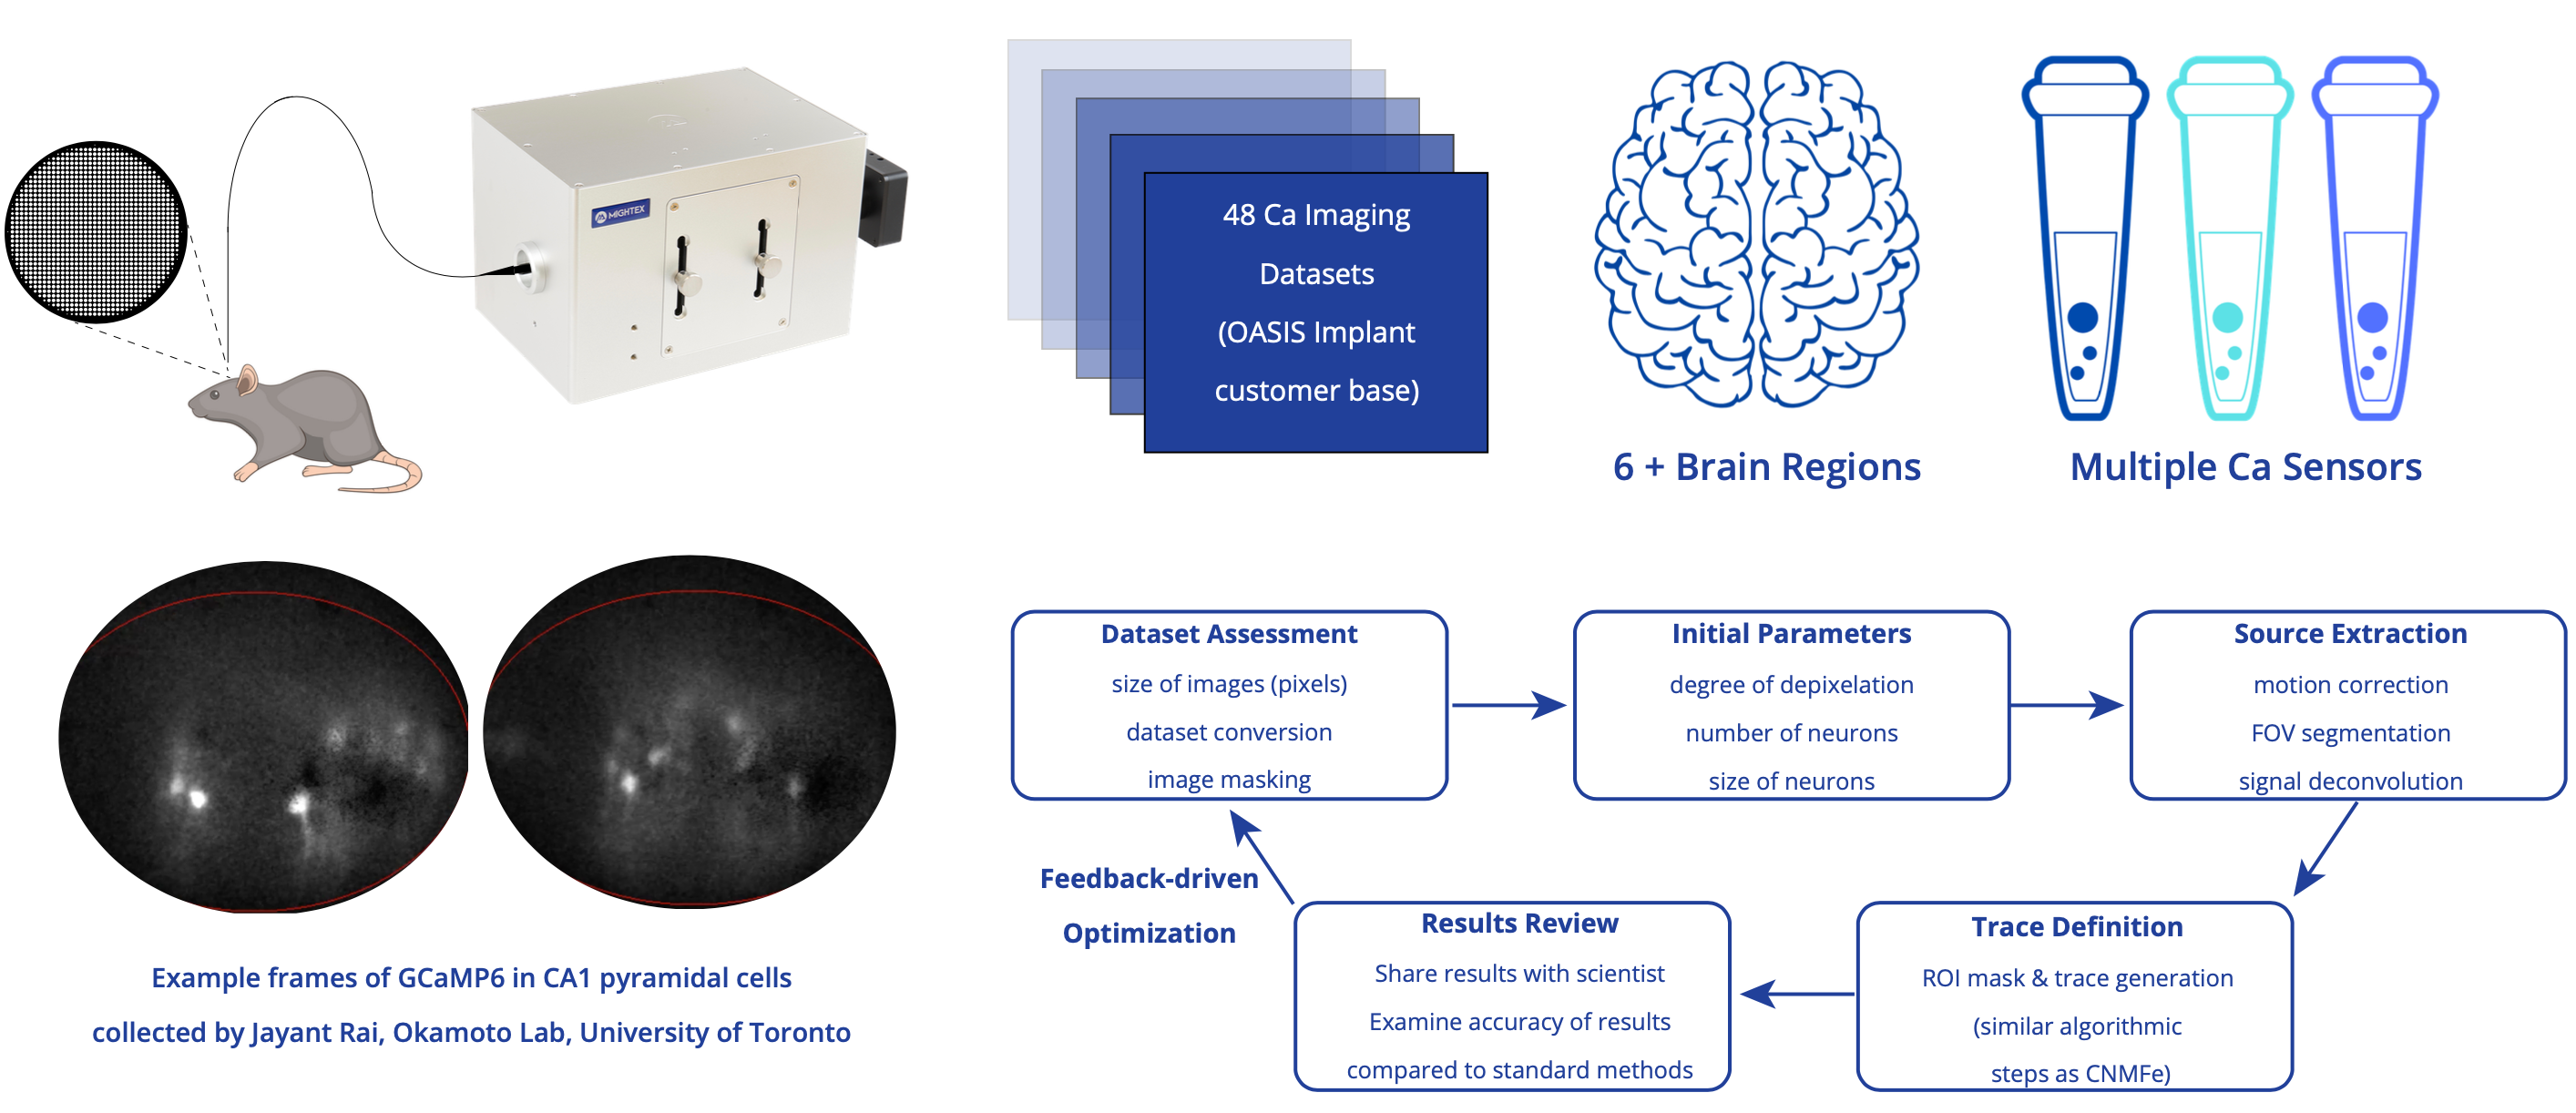
Catherine Thomas, Xuejun Du, Kai Wang, Jayant Rai, Kenichi Okamoto, Miles Li, Jian Zhao.
A Novel Data Analysis Pipeline for Fiber-based in Vivo Calcium Imaging. Neuroscience Reports, 15(1), pp. S342-S343, 2023.
[W11]
Pengcheng An, Chaoyu Zhang, Haicheng Gao, Ziqi Zhou, Linghao Du, Che Yan, Yage Xiao, Jian Zhao.
Affective Affordance of Message Balloon Animations: An Early Exploration of AniBalloons. Companion Publication of the ACM Conference on Computer-Supported Cooperative Work and Social Computing, pp. 138-143, 2023.
[W10]
Pengcheng An, Chaoyu Zhang, Haicheng Gao, Ziqi Zhou, Zibo Zhang, Jian Zhao.
Animating Chat Balloons to Convey Emotions: theDesign Exploration of AniBalloons. Proceedings of the Graphics Interface Conference (Poster), 2023.
2022
[J30]
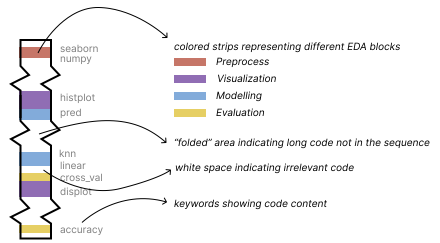
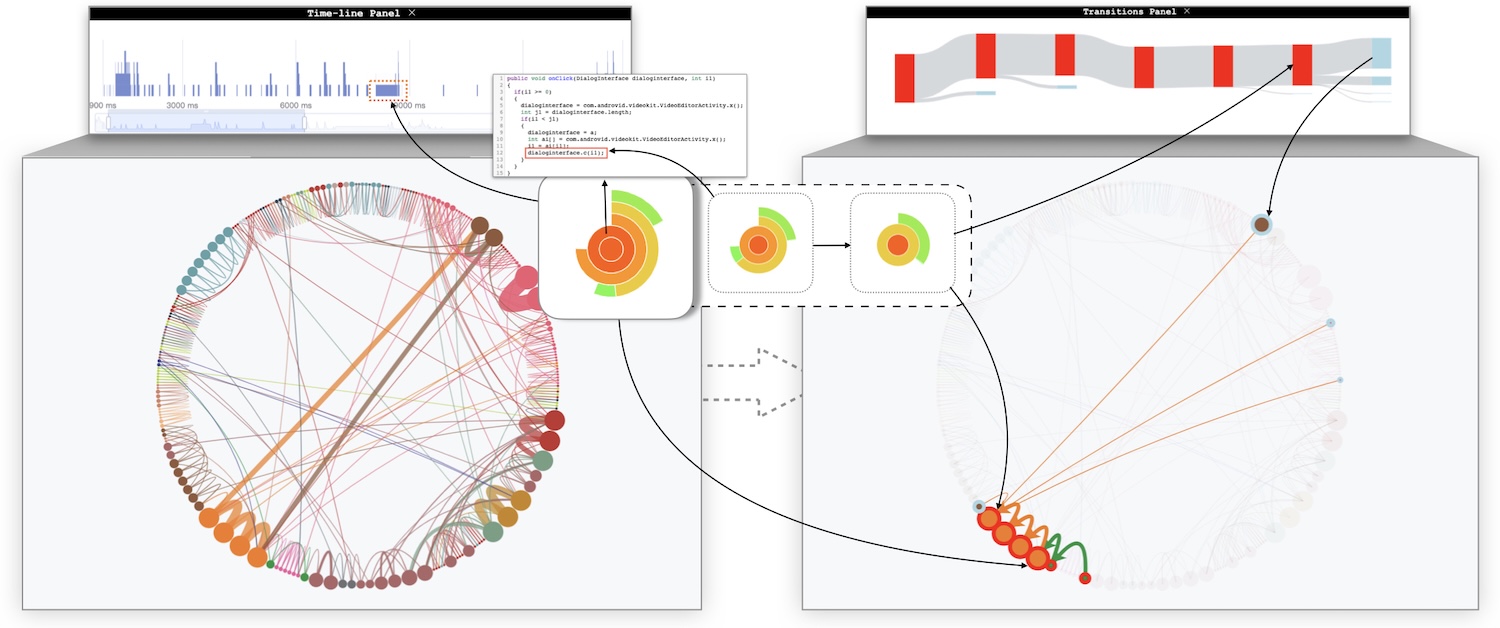
Xingjun Li†, Yizhi Zhang†, Justin Leung†, Chengnian Sun, Jian Zhao.
EDAssistant: Supporting Exploratory Data Analysis in Computational Notebooks with In-Situ Code Search and Recommendation. ACM Transactions on Interactive Intelligent Systems, 13(1), pp. 1:1-1:27, 2023 (Accepted in 2022).
[J29]
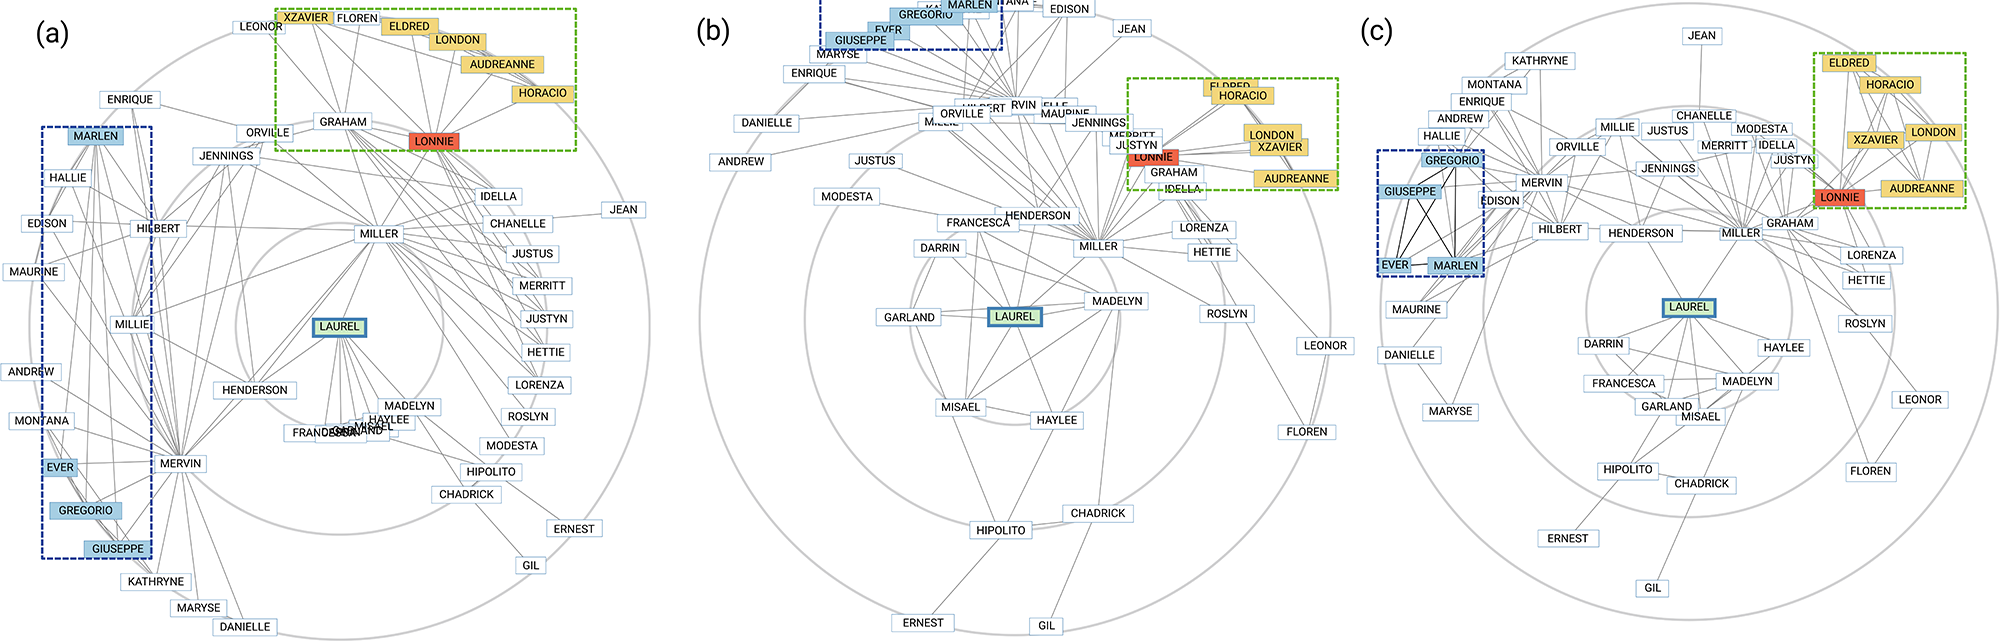
Mingliang Xue, Yunhai Wang, Chang Han, Jian Zhang, Zheng Wang, Kaiyi Zhang, Christophe Hurter, Jian Zhao, Oliver Deussen.
Target Netgrams: An Annulus-constrained Stress Model for Radial Graph Visualization. IEEE Transactions on Visualization and Computer Graphics, 29(10), pp. 4256-4268, 2023 (Accepted in 2022).
[J28]
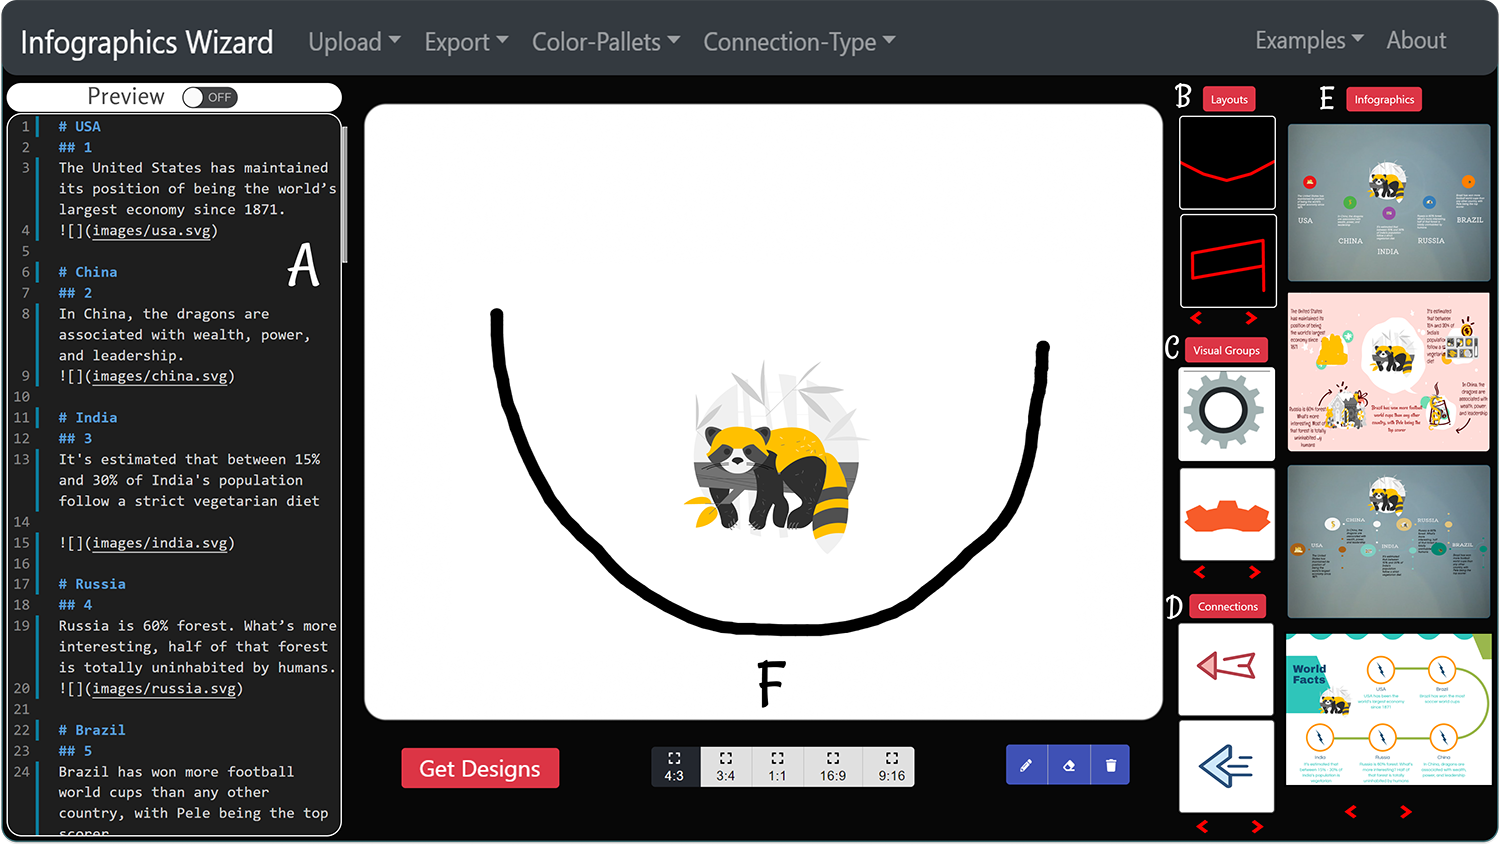
Anjul Tyagi, Jian Zhao, Pushkar Patel, Swasti Khurana, Klaus Mueller.
Infographics Wizard: Flexible Infographics Authoring and Design Exploration. Computer Graphics Forum (Proceedings of EuroVis 2022), 41(3), pp. 121-132, 2022.
[J27]
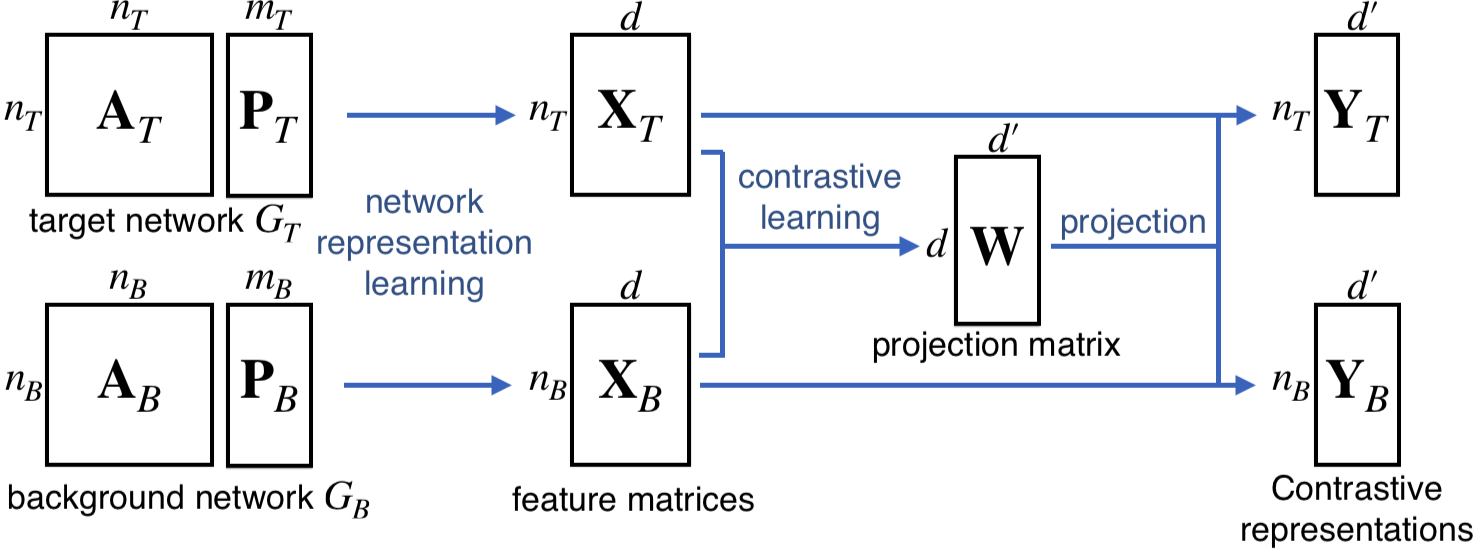
Takanori Fujiwara, Jian Zhao, Francine Chen, Yaoliang Yu, Kwan-Liu Ma.
Network Comparison with Interpretable Contrastive Network Representation Learning. Journal of Data Science, Statistics, and Visualization, 2(5), pp. 1-35, 2022.
[S6]
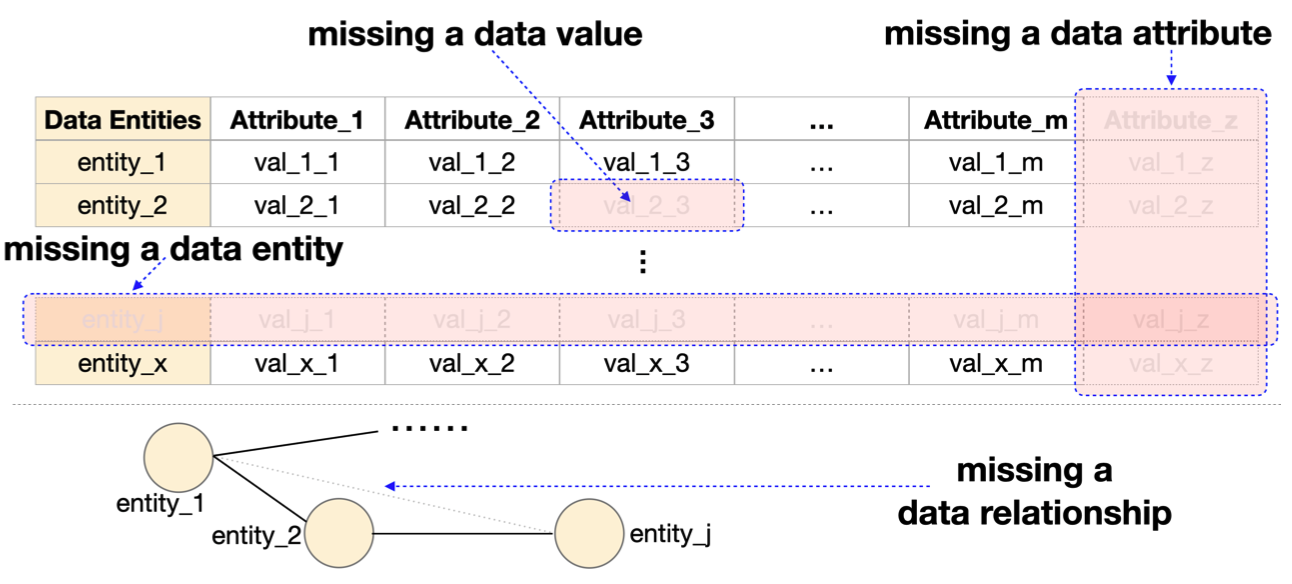
Maoyuan Sun, Yue Ma, Yuanxin Wang, Tianyi Li, Jian Zhao, Yujun Liu, Ping-Shou Zhong.
Toward Systematic Considerations of Missingness in Visual Analytics. Proceedings of the IEEE Visualization and Visual Analytics Conference, pp. 110-114, 2022.
[C23]
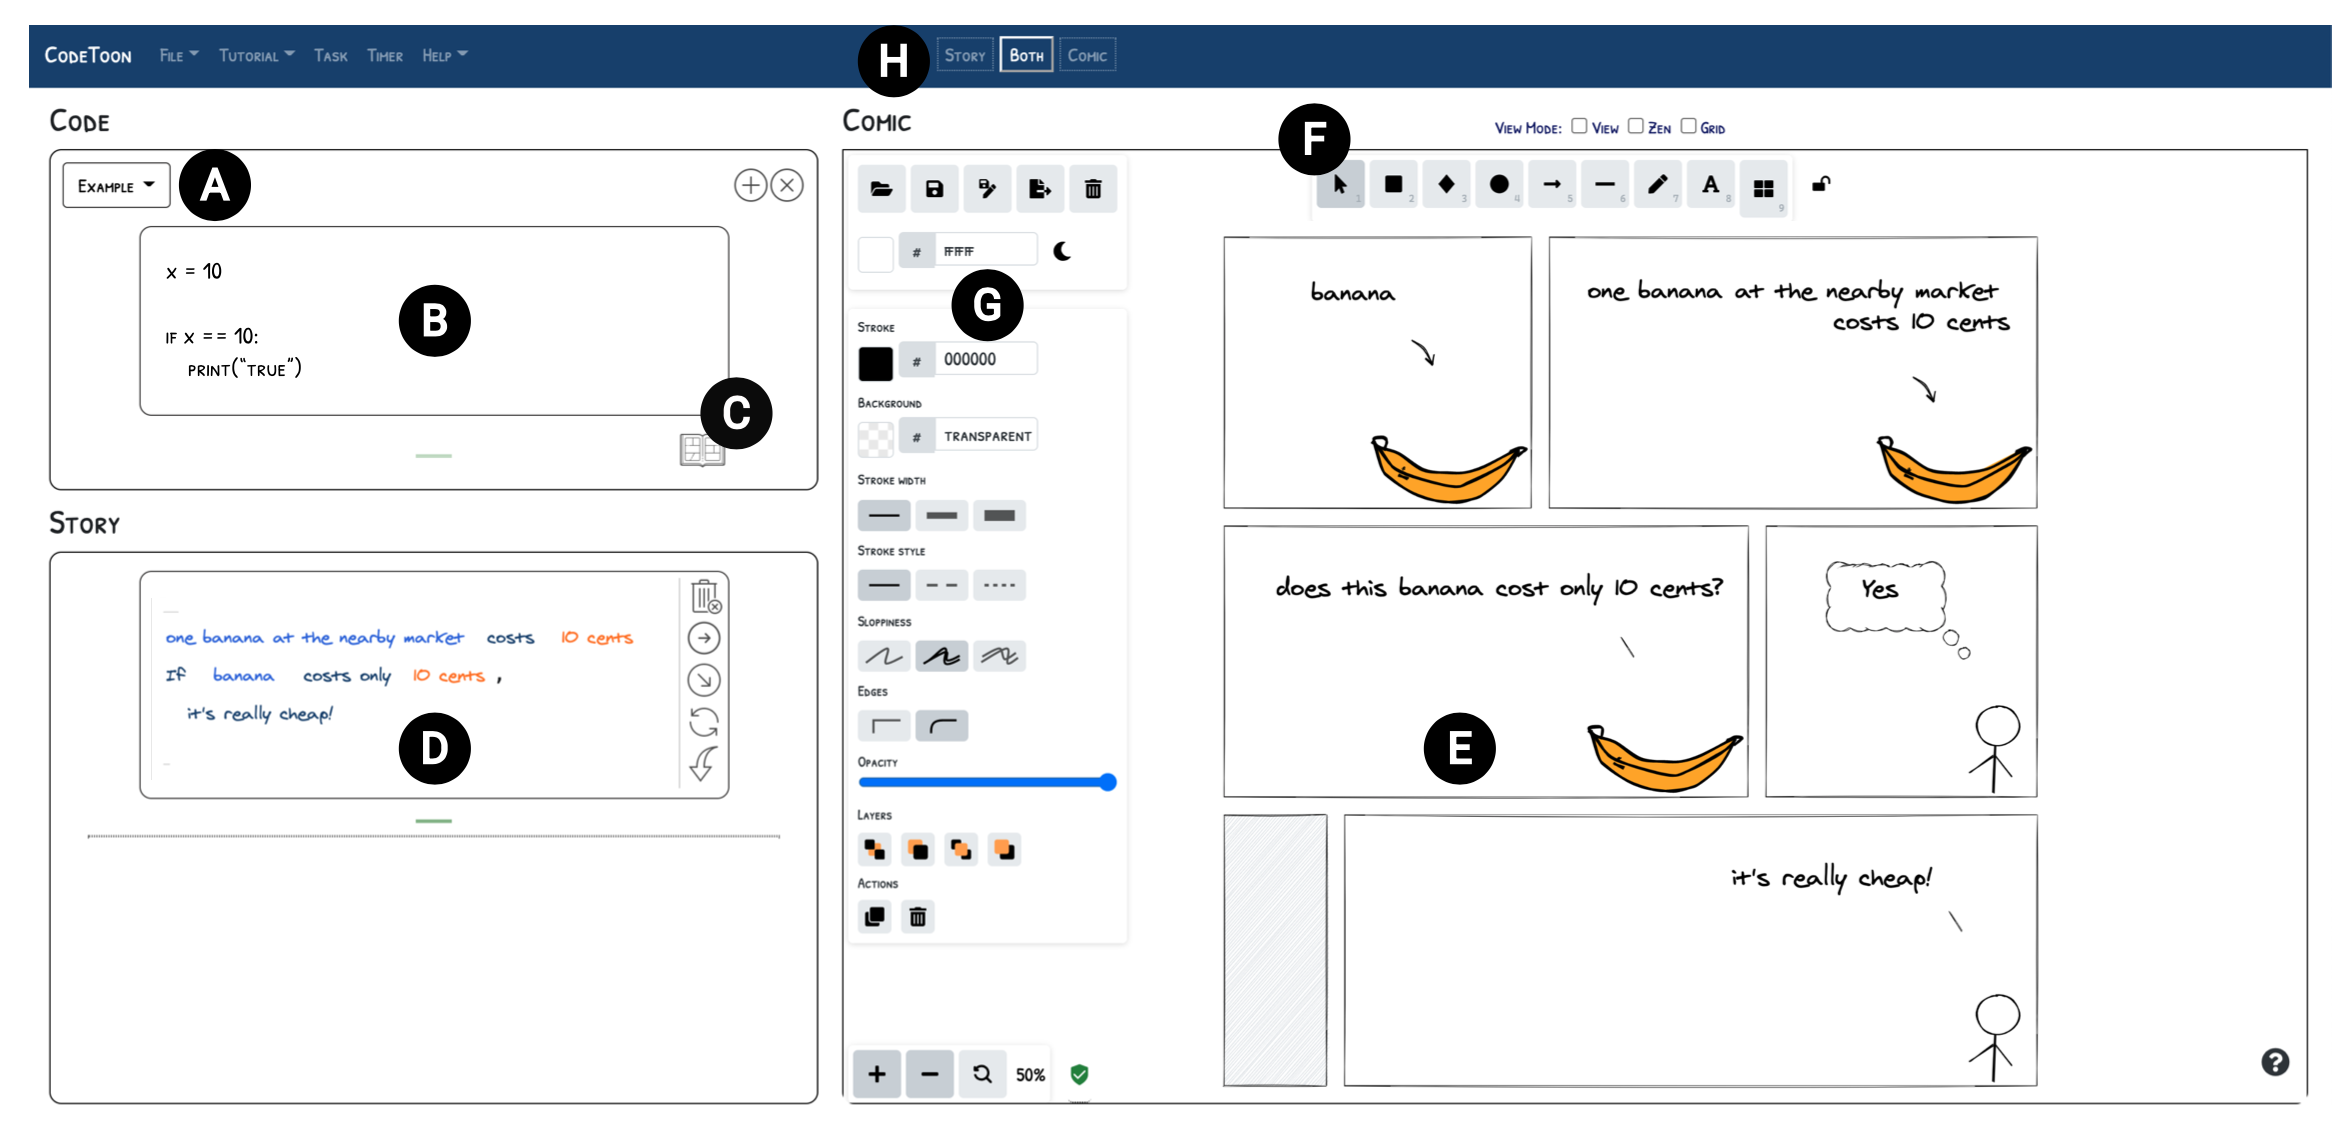
Sangho Suh, Jian Zhao, Edith Law.
CodeToon: Story Ideation, Auto Comic Generation, and Structure Mapping for Code-Driven Storytelling. Proceedings of the ACM Symposium on User Interface Software and Technology, pp. 13:1-13:16, 2022.
[C22]
Nikhita Joshi†, Matthew Lakier†, Daniel Vogel, Jian Zhao.
A Design Framework for Contextual and Embedded Information Visualizations in Spatial Augmented Reality. Proceedings of the Graphics Interface Conference, pp. 24:1-24:12, 2022.
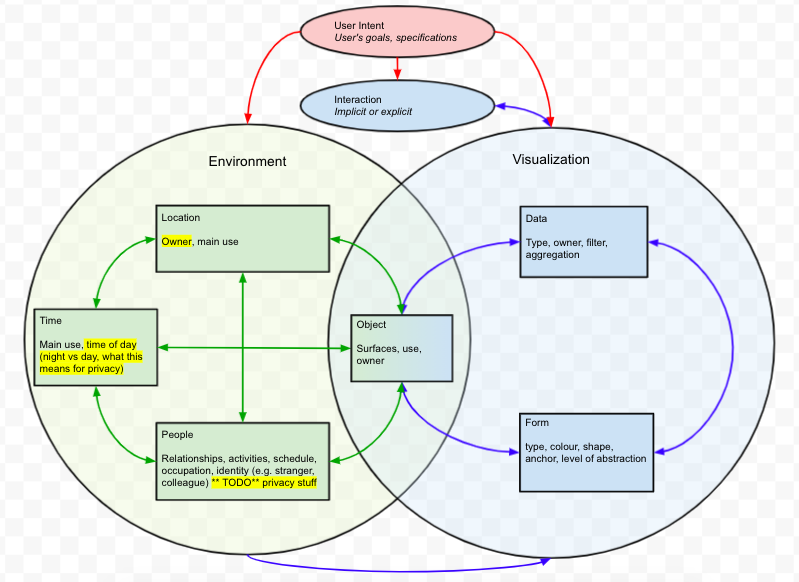
[C21]
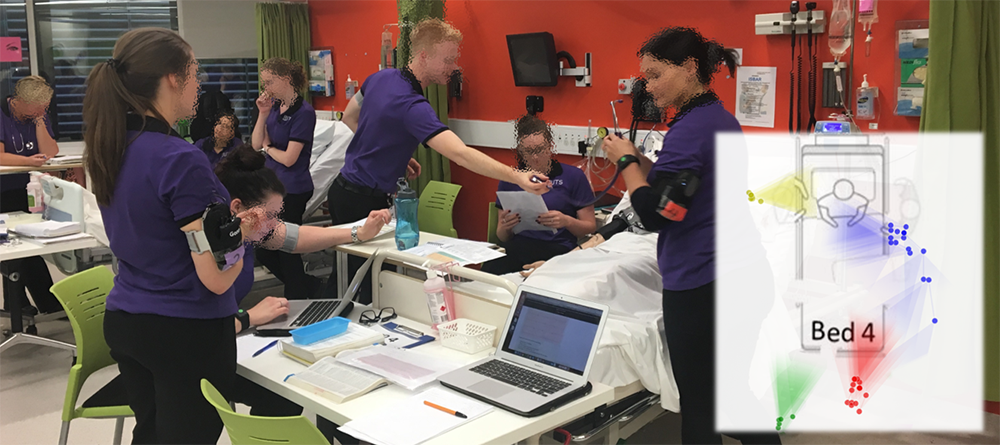
Gloria Fernandez-Nieto, Pengcheng An, Jian Zhao, Simon Buckingham Shum, Roberto Martinez-Maldonado.
Classroom Dandelions: Visualising Participants' Position, Trajectories and Body Orientation Augments Teachers' Sensemaking. Proceedings of the ACM SIGCHI Conference on Human Factors in Computing Systems, pp. 564:1-564:17, 2022.
[C20]
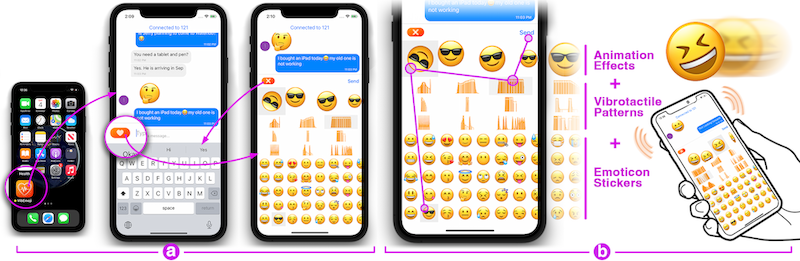
Pengcheng An†, Ziqi Zhou†, Qing Liu†, Yifei Yin, Linghao Du, Da-Yuan Huang, Jian Zhao.
VibEmoji: Exploring User-authoring Multi-modal Emoticons in Social Communication. Proceedings of the ACM SIGCHI Conference on Human Factors in Computing Systems, pp. 493:1-493:17, 2022.
[C19]
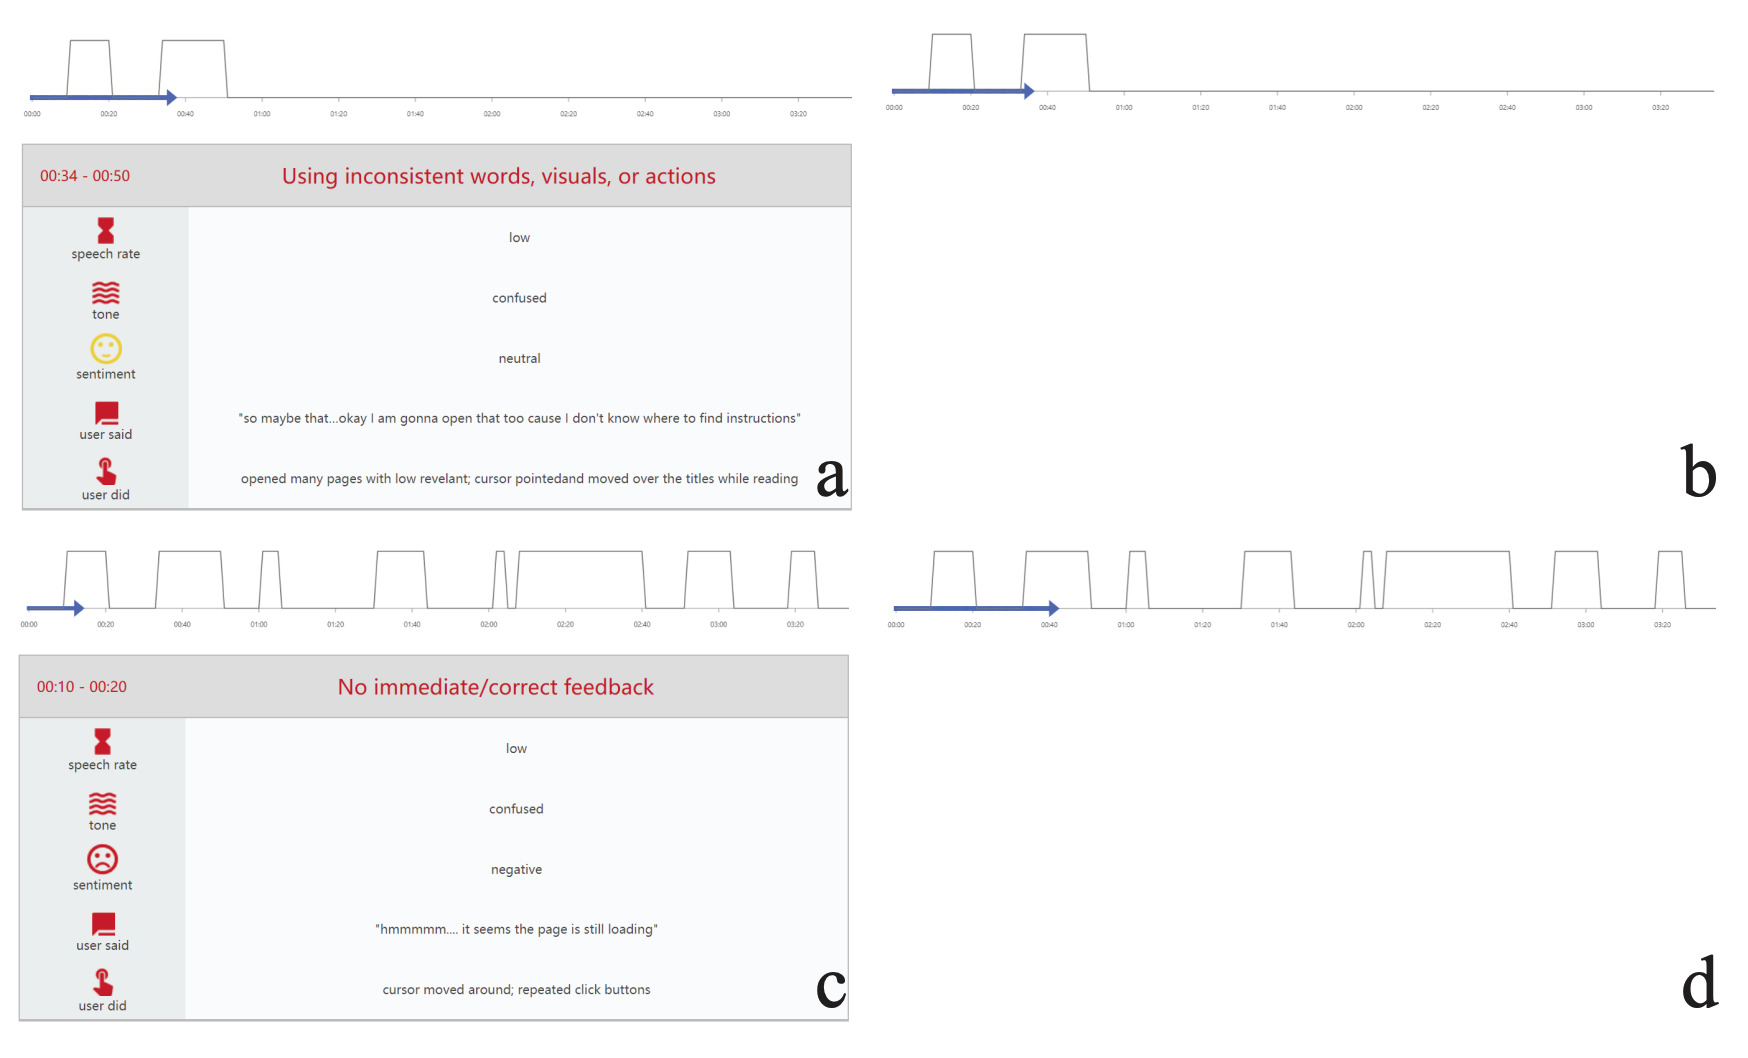
Mingming Fan, Xianyou Yang†, Tsz Tung Yu†, Vera Q. Liao, Jian Zhao.
Human-AI Collaboration for UX Evaluation: Effects of Explanation and Synchronization. Proceedings of the ACM on Human-Computer Interaction, 6(CSCW1), pp. 96:1-96:32, 2022.
[W9]
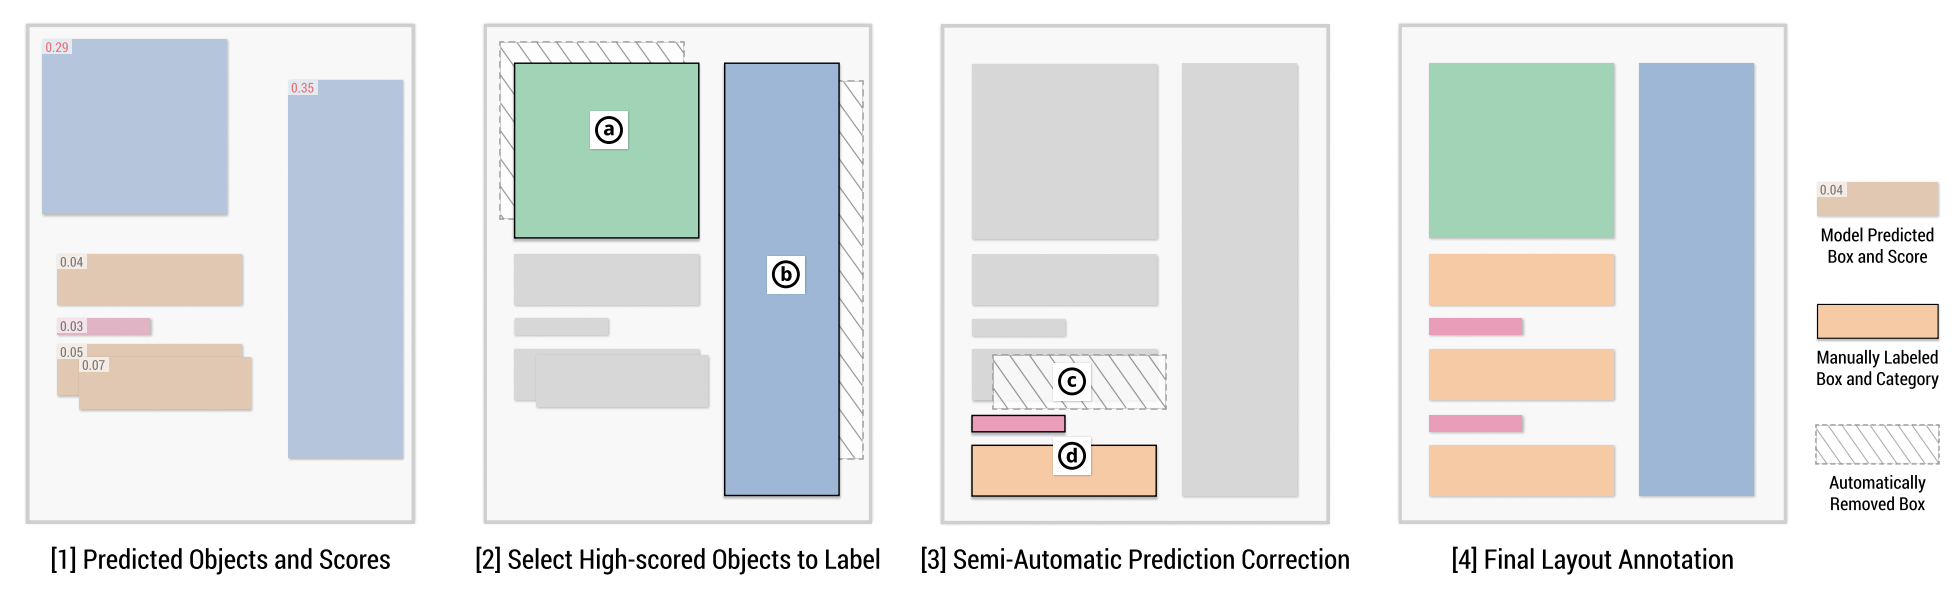
Zejiang Shen, Weining Li, Jian Zhao, Melissa Dell, Yaoliang Yu.
OLALA: Object-Level Active Learning Based Layout Annotation. Proceedings of the EMNLP 5th Workshop on Natural Language Processing and Computational Social Science, 2022.
See the complete publication list...
Thesis
[T1]
Jian Zhao
Interactive Visual Data Exploration: A Multi-Focus Approach. Department of Computer Science, University of Toronto, 2015.
Patents
[P22]
Wei Zhou, Mona Loorak, Ghazaleh Saniee-Monfared, Sachi Mizobuchi, Pourang Irani, Jian Zhao, Wei Li. Methods, Devices, Media for Input/Output Space Mapping in Head-Based Human-Computer Interactions. US11797081B2, Filed in 2021, Granted in 2023.
[P21]
Takanori Fujiwara, Jian Zhao, Francine Chen. System and Method for Contrastive Network Analysis and Visualization. US11538552B2, Filed in 2020, Granted in 2022.
[P20]
Jian Zhao System and Method for Summarizing and Steering Multi-User Collaborative Data Analysis. US10937213B2, Filed in 2019, Granted in 2021.
[P19]
Jian Zhao, Francine Chen System and Method for Automatically Sorting Ranked Items and Generating a Visual Representation of Ranked Results. US11010411B2, Filed in 2019, Granted in 2021.
[P18]
Hideto Oda, Chidansh Bhatt, Jian Zhao. Optimized Parts Pickup List and Routes for Efficient Manufacturing using Frequent Pattern Mining and Visualization. US20200226505A1, Filed in 2018, Granted in 2021.
[P17]
Patrick Chiu, Chelhwon Kim, Hajime Ueno, Yulius Tjahjadi, Anthony Dunnigan, Francine Chen, Jian Zhao,Bee-Yian Liew, Scott Carter. System for Searching Documents and People based on Detecting Documents and People around a Tables. US10810457B2, Filed in 2018, Granted in 2020.
[P16]
Jian Zhao, Francine Chen, Patrick Chiu. A Visual Analysis Framework for Understanding Missing Links in Bipartite Networks. US11176460B2, Filed in 2018, Granted in 2021.
[P15]
John Wenskovitch, Jian Zhao, Matthew Cooper, Scott Catter System and Method for Computational Notebook Interface. US10768904B2, Filed in 2018, Granted in 2020.
[P14]
Francine Chen, Jian Zhao, Yan-Ying Chen. System and Method for Generating Titles for Summarizing Conversational Documents. US20200026767A1, Filed in 2018, Abandoned.
[P13]
Jian Zhao, Yan-Ying Chen, Francine Chen. System and Method for Creating Visual Representation of Data based on Generated Glyphs. US10649618B2, Filed in 2018, Granted in 2020.
[P12]
Jian Zhao, Chidansh Bhatt, Matthew Cooper, Ayman Shamma. System and Method for Visualizing and Recommending Media Content Based on Sequential Context. US10776415B2, Filed in 2018, Granted in 2020.
[P11]
Jian Zhao, Siwei Fu. System and Method for Analyzing and Visualizing Team Conversational Data. US11086916B2, Filed in 2017, Granted in 2021.
[P10]
Jian Zhao, Francine Chen, Patrick Chiu. System for Visually Exploring Coordinated Relationships in Data. US10521445B2, Filed in 2017, Granted in 2019.
[P9]
Jian Zhao, Francine Chen, Patrick Chiu. System and Method for Visual Exploration of Sub-Network Patterns in Two-Mode Networks. US11068121B2, Filed in 2017, Granted in 2021.
[P8]
Jian Zhao, Francine Chen, Patrick Chiu. System and Method for Visually Exploring Search Results in Two-Mode Networks. US10521445B2, Filed in 2017, Granted in 2021.
[P7]
Francine Chen, Jian Zhao, Yan-Ying Chen. System and Method for User-Oriented Topic Selection and Browsing. US11080348B2, Filed 2017, Granted in 2021.
[P6]
Michael Glueck, Azam Khan, Jian Zhao. Handoff Support in Asynchronous Analysis Tasks using Knowledge Transfer Graphs. US20180081885A1, 2017.
[P5]
Jian Zhao, Michael Glueck, Azam Khan, Simon Breslay. Techniques For Mixed-Initiative Visualization of Data. US11663235B2, Filed in 2017, Granted in 2023.
[P4]
Jian Zhao, Michael Glueck, Azam Khan. Node-Centric Analysis of Dynamic Networks. US10142198B2, Filed in 2017, Granted in 2018.
[P3]
Mira Dontcheva, Jian Zhao, Aaron Hertzmann, Allan Wilson, Zhicheng Liu. Providing Visualizations of Event Sequence Data. US9577897B2, Filed in 2015, Granted in 2017.
[P2]
Liang Gou, Fei Wang, Jian Zhao, Michelle Zhou. Personal Emotion State Monitoring from Social Media. US20150213002A1, Filed in 2014, Abandoned.
[P1]
Jian Zhao, Steven Drucker, Danyel Fisher, Donald Brinkman. Relational Rendering of Multi-Faceted Data. US8872849B2, Filed in 2011, Granted in 2014.